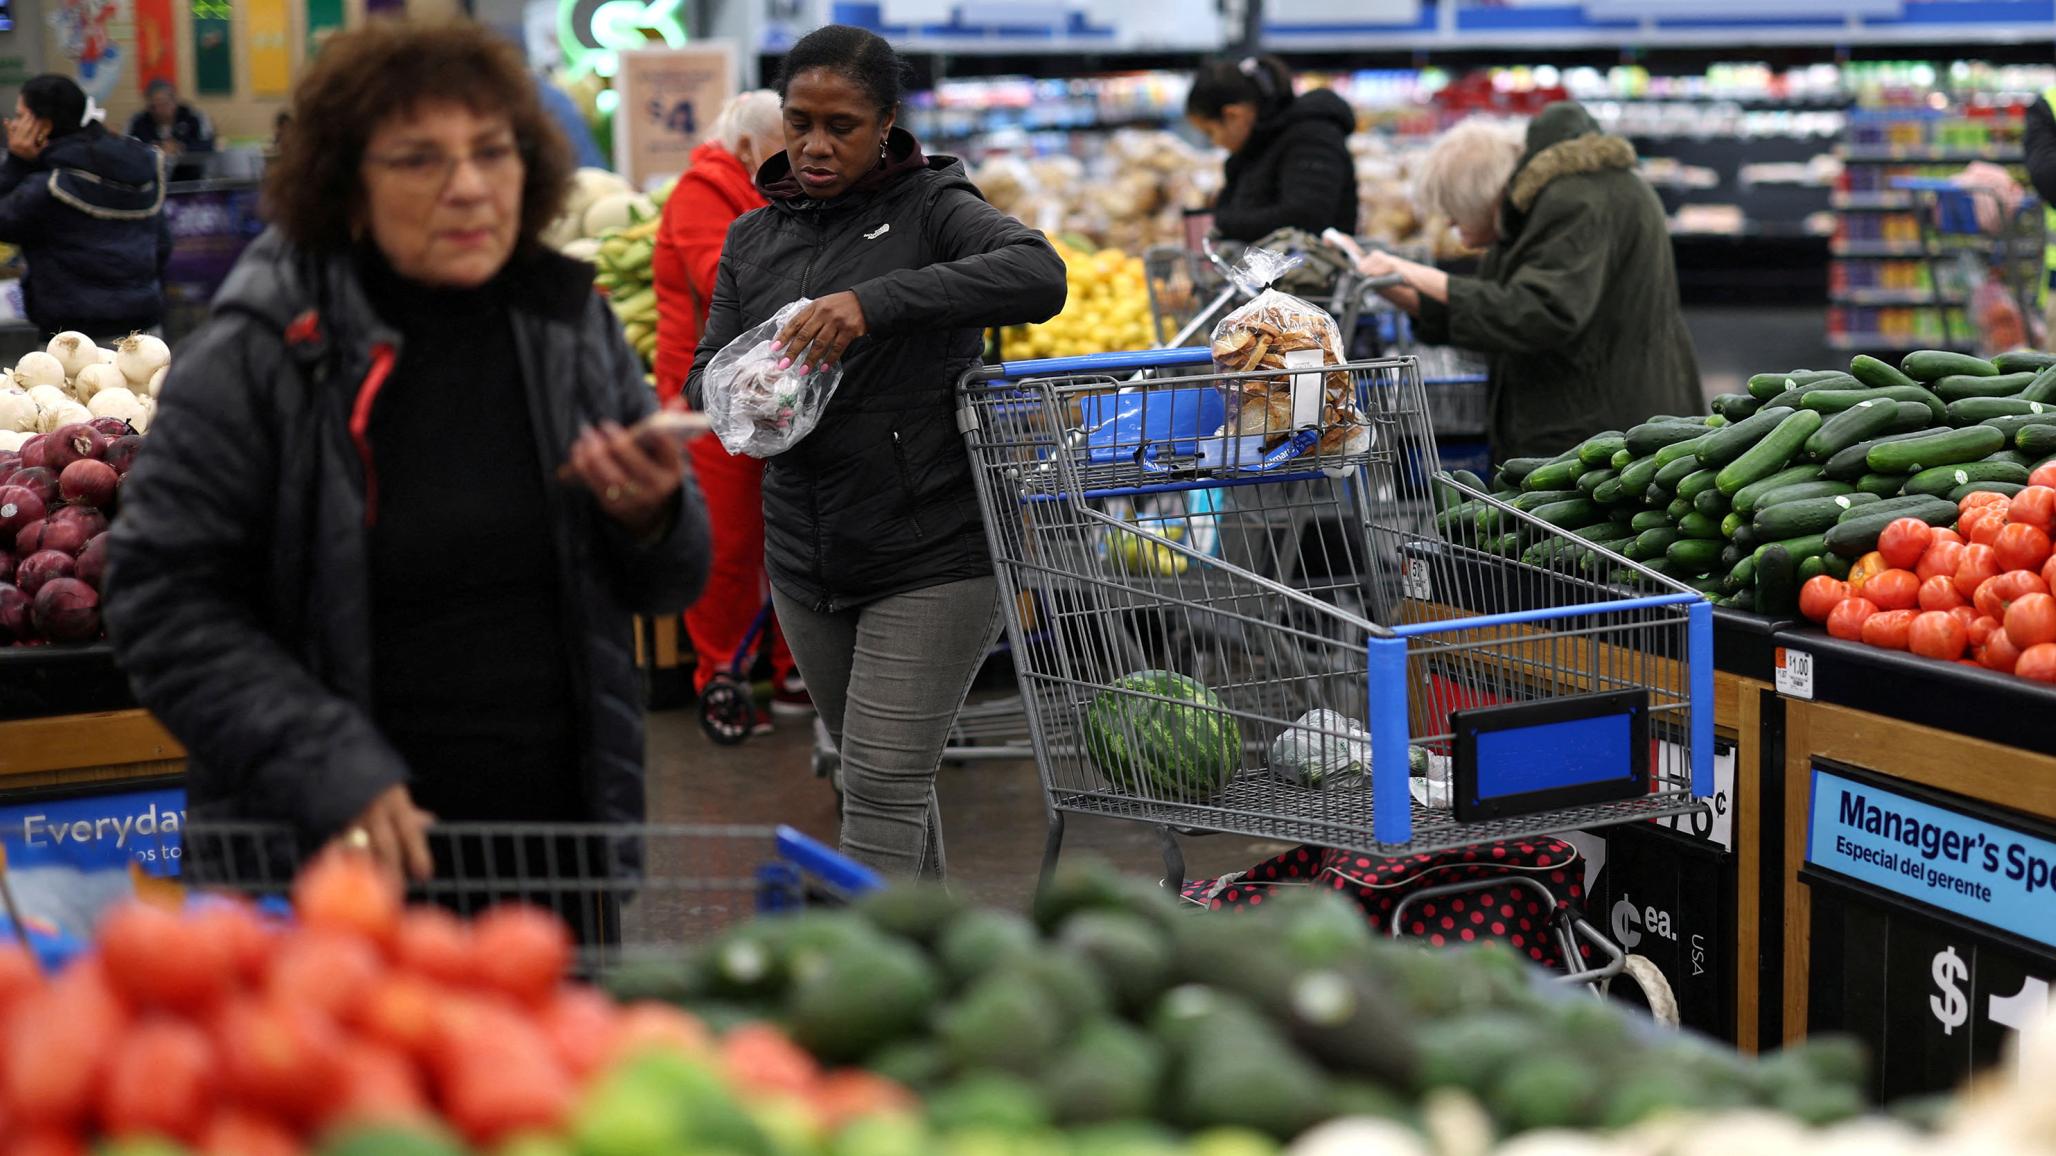
New York City mayor-elect Zohran Mamdani won office early this month promising to address voters’ concerns about “affordability.” Soon after, on November 14, President Donald Trump issued an executive order removing tariffs he had imposed on hundreds of grocery items.
Trump had claimed for months that the tariffs would all be paid by foreign exporters, not American consumers. But after lifting duties on certain foods, he conceded that tariffs may raise some US prices.
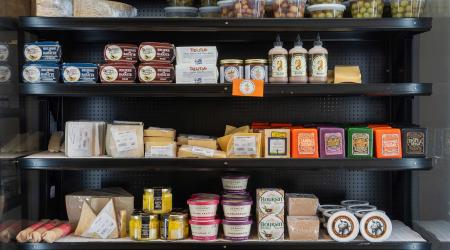
The tariff relief list includes lots of familiar groceries: meats, vegetables, fruits, coffee and tea, cocoa, and more, as shown in figure 1 and the appendix table. Rolling back the tariffs could potentially result in price reductions of roughly 2.6 percent for bananas, 7.3 percent for coffee, and 6.8 percent for nuts, assuming retailers pass the full cost cuts on to consumers.[1]
Altogether, the annual value of the tariff reductions averages to $35 per US household—an amount more significant to low-income than high-income families. This compares, however, with the Yale Budget Lab estimate that the added costs of the full suite of Trump tariffs—after the November 14 relief—are worth an annual average of $1,700 per household.
The tariff relief list covers approximately $85 billion in annual imports. The tariffs removed are worth a total of $4.6 billion per year, and US households number 133 million.
As a matter of tariff history, the protectionist McKinley Tariff of 1890 and the equally protectionist Smoot-Hawley Tariff of 1930 both exempted from duties a wide range of foodstuffs and primary materials not produced in the United States. Why impose tariffs, the legislators of yesteryear asked, on such goods? In a modest way, Trump’s November 14 executive order recalls past sensibilities.
Figure 2 lists the exporting countries that will enjoy an estimated reduction of at least 40 percent of US tariffs on certain products as a result of Trump’s November 14 executive order. Nearly all countries on the list are very small exporters of primary foodstuffs. Comoros, a small island nation in the Indian Ocean that exports vanilla beans to the United States, leads with 100 percent relief. The vast majority of countries are in Africa, South America, or the Caribbean.
Appendix
| US cumulative imports of food and agricultural products exempted from tariffs under November 14 announcement | |||||
|
Tariff revenue as a percentage of CIF import values |
Difference between 2024 and 2025 tariff revenue as a percentage of CIF import values, Apr-Aug |
Annualized 2025 imports |
Calculated savings |
||
| Category |
Apr-Aug 2024 |
Apr-Aug 2025 |
|||
| Meat and edible meat offal |
3.20% |
9.90% |
6.70% |
14,214.0 |
949.0 |
| Edible vegetables and certain roots and tubers |
0.10% |
0.90% |
0.80% |
3,573.0 |
29.0 |
| Edible fruit and nuts; peel of citrus fruit or melons |
0.20% |
4.60% |
4.40% |
14,066.0 |
625.0 |
| Coffee, tea, mate and spices |
0.20% |
7.50% |
7.30% |
16,416.0 |
1,198.0 |
| Cereals |
0.10% |
0.30% |
0.30% |
35.0 |
0.1 |
| Milling industry products; malt; starches; inulin; wheat gluten |
0.30% |
6.70% |
6.40% |
215.0 |
14.0 |
| Oil seeds and oleaginous fruits; miscellaneous grains, seeds and fruits; industrial or medicinal plants; straw and fodder |
0.02% |
7.20% |
7.20% |
18.0 |
1.0 |
| Vegetable plaiting materials and vegetable products, nesoi |
1.30% |
6.80% |
5.50% |
169.0 |
9.0 |
| Animal or vegetable fats and oils and their cleavage products; prepared edible fats; animal or vegetable waxes |
0.02% |
7.10% |
7.10% |
1,067.0 |
76.0 |
| Edible preparations of meat, fish, crustaceans, molluscs or other aquatic invertebrates |
1.10% |
9.20% |
8.10% |
680.0 |
55.0 |
| Cocoa and cocoa preparations |
0.02% |
6.60% |
6.60% |
8,,702.0 |
576.0 |
| Preparations of cereals, flour, starch or milk; bakers' wares |
0.40% |
3.00% |
2.60% |
7574.0 |
195.0 |
| Preparations of vegetables, fruit, nuts, or other parts of plants |
2.80% |
7.90% |
5.20% |
5,311.0 |
274.0 |
| Miscellaneous edible preparations |
2.50% |
9.10% |
6.60% |
7,097.0 |
470.0 |
| Beverages, spirits and vinegar |
1.80% |
4.30% |
2.50% |
3.0 |
0.1 |
| Fertilizers |
0.10% |
1.70% |
1.60% |
5,827.0 |
93.0 |
| Essential oils and resinoids; perfumery, cosmetic or toilet preparations |
0.90% |
9.90% |
9.00% |
375.0 |
34.0 |
| Total | $85.3 billion | $4.6 billion | |||
| CIF = cost, insurance, freight | |||||
| Notes: Products identified at the 8-digit Harmonized System (HS) level are those listed in section F of the updated annex file of the November 14 executive order and have been aggregated to the HS-2 level. Import figures are annualized trade flows calculated using year-to-date data from January to August 2025 (at the time of writing). Calculated savings for each category are approximated by multiplying the tariff revenue collected percentage difference by the respective annualized imports. | |||||
| Source: US International Trade Commission (USITC) DataWeb. | |||||
Note
1. The following Harmonized Tariff Schedule of the United States (HTSUS) codes from the annex file represent bananas, coffee, and nuts, respectively: bananas (20089915), coffee (all listed products starting with 0901), and nuts (all listed products starting with 0802, as well as 08012100, 08012200, 08013100,08013200). Similar to the appendix table, price reductions for these food items are based on using the difference between 2024 and 2025 tariff revenue as a percentage of CIF imports (April-August) as the proxy for tariff relief.
Data Disclosure
Related Documents
- Document2025-11-25-hufbauer-zhang.zip (38.43 MB)