
This is the third in what I expect will be a series of five posts on the vulnerability of the economy to a collapse in what could be an AI bubble. The first used the Fed’s large-scale macroeconomic model, FRB/US, to estimate the contribution of the AI boom to the economy and the second assessed the magnitude of possible stock market declines. Future posts will look at the broader financial system and the system’s shock absorbers.
How bad would it be for the economy if AI is a bubble and it bursts? In my last post I looked at how far the stock market might fall. This post is a deep dive into one channel through which a bear market would hurt the economy: consumers cutting back their spending if the stock market falls, aka the wealth effect. In the course of working on it I learned two relevant things that surprised me. The first is that the 2001 recession was barely a result of consumer spending cutbacks after the market fell; in fact, it was the least consumer-driven recession in both relative and absolute terms in the postwar period. The second is that consumers, in aggregate, have been surprisingly prudent in spending the recent stock increases—spending only about 1 cent of every dollar the market has gone up, meaning they would not need to cut their spending back dramatically on the way down.
This post examines the three scenarios that I justified in more detail in the previous installment. The baseline is a 25 percent decline in the market. But “baseline” should not be thought of as a base case—in fact, market pricing puts the probability of a decline of this magnitude sustained through the end of 2027 at less than 10 percent. A bad case is a 35 percent decline. And the severe case—which I view as very unlikely (market pricing puts it at about 2 percent; I would go above that but not by much)—is a 50 percent decline.
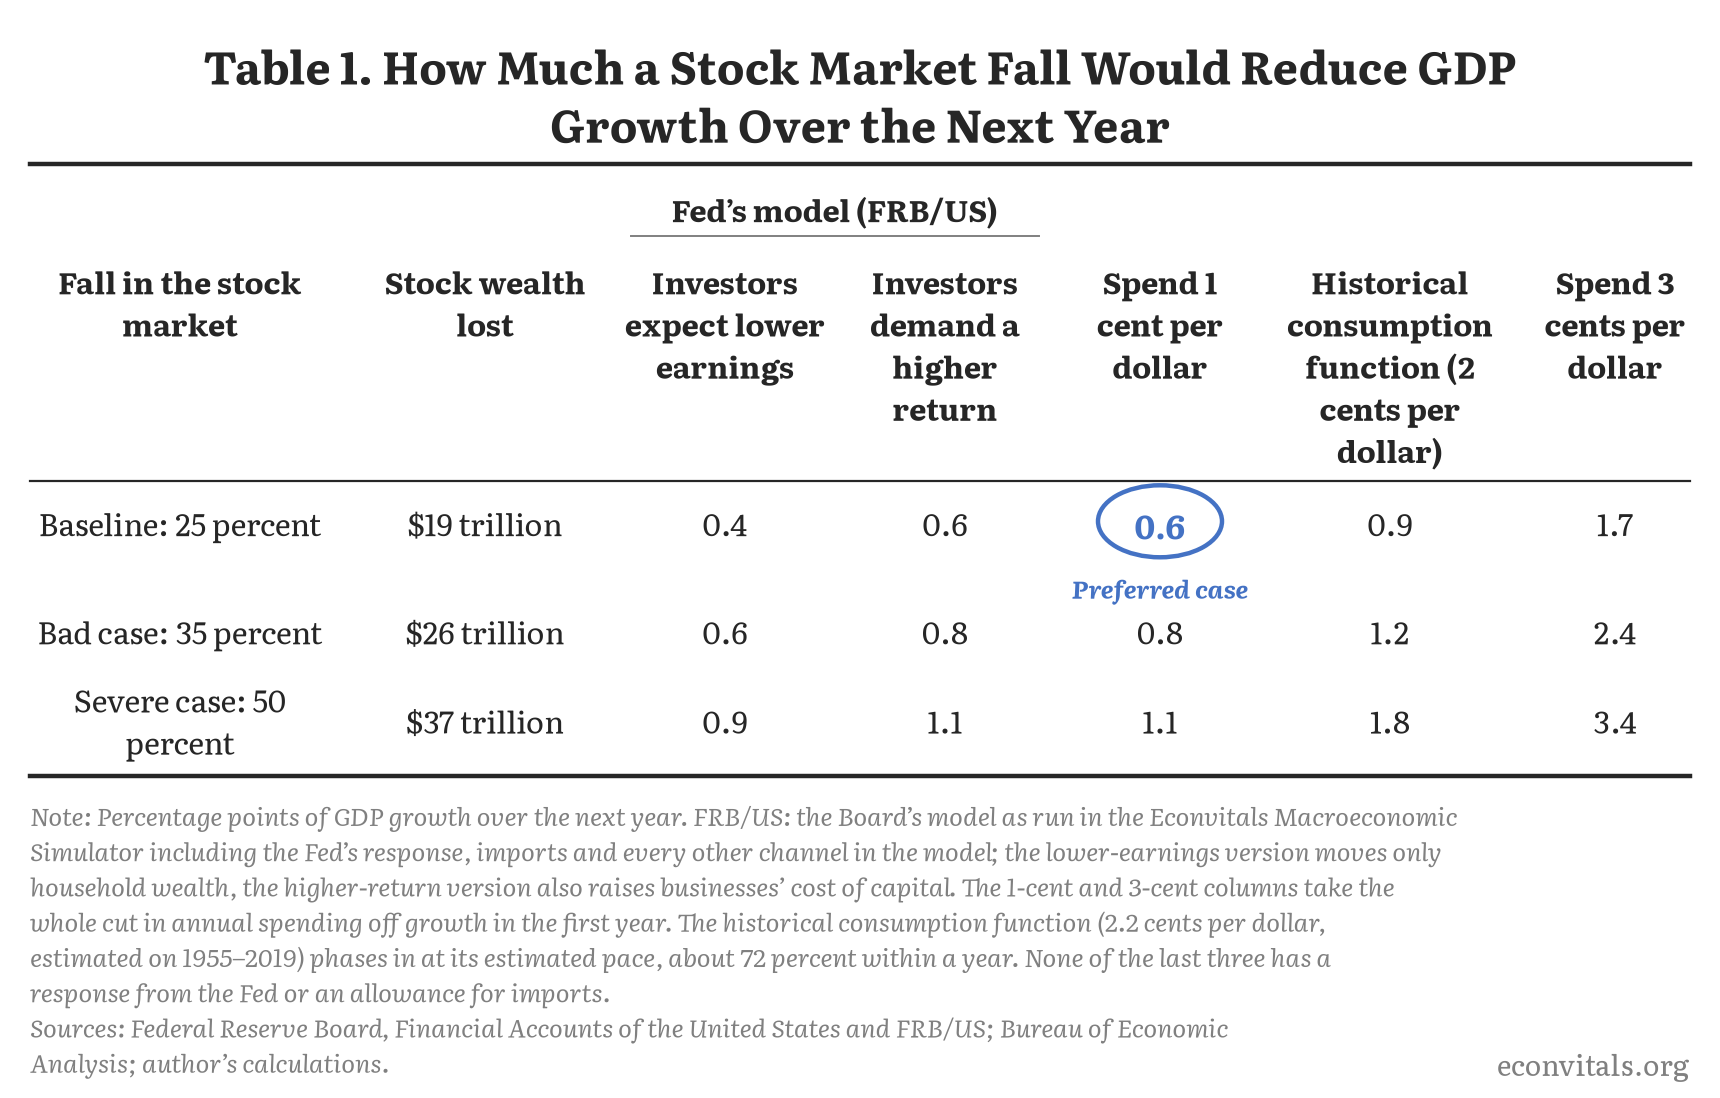
The bottom line of this analysis is that spending cutbacks if there is a bubble that bursts are expected to reduce economic growth by about 0.6 percentage point over the next year according to my preferred specification (Table 1), looking only at the effect of the stock market decline on consumption and ignoring other channels that could either exacerbate or mitigate the effect. The magnitude could be as large as 3.4 percentage points, but I view that happening solely through the wealth effect on consumption—the sole subject of this post—as a very remote tail risk.
In the remainder I start with what history says about stock market falls, move to the current context and then discuss what it means for economic growth.
Stock market declines called 17 of the last 9 recessions
Paul Samuelson famously quipped that the stock market “predicted nine out of the last five recessions.” The current tally is 17 of the last 9 since 1946 for declines of 20 percent or more in the U.S. stock market as a whole (Figure 1). Stock declines also missed three recessions that came without a decline of that magnitude.
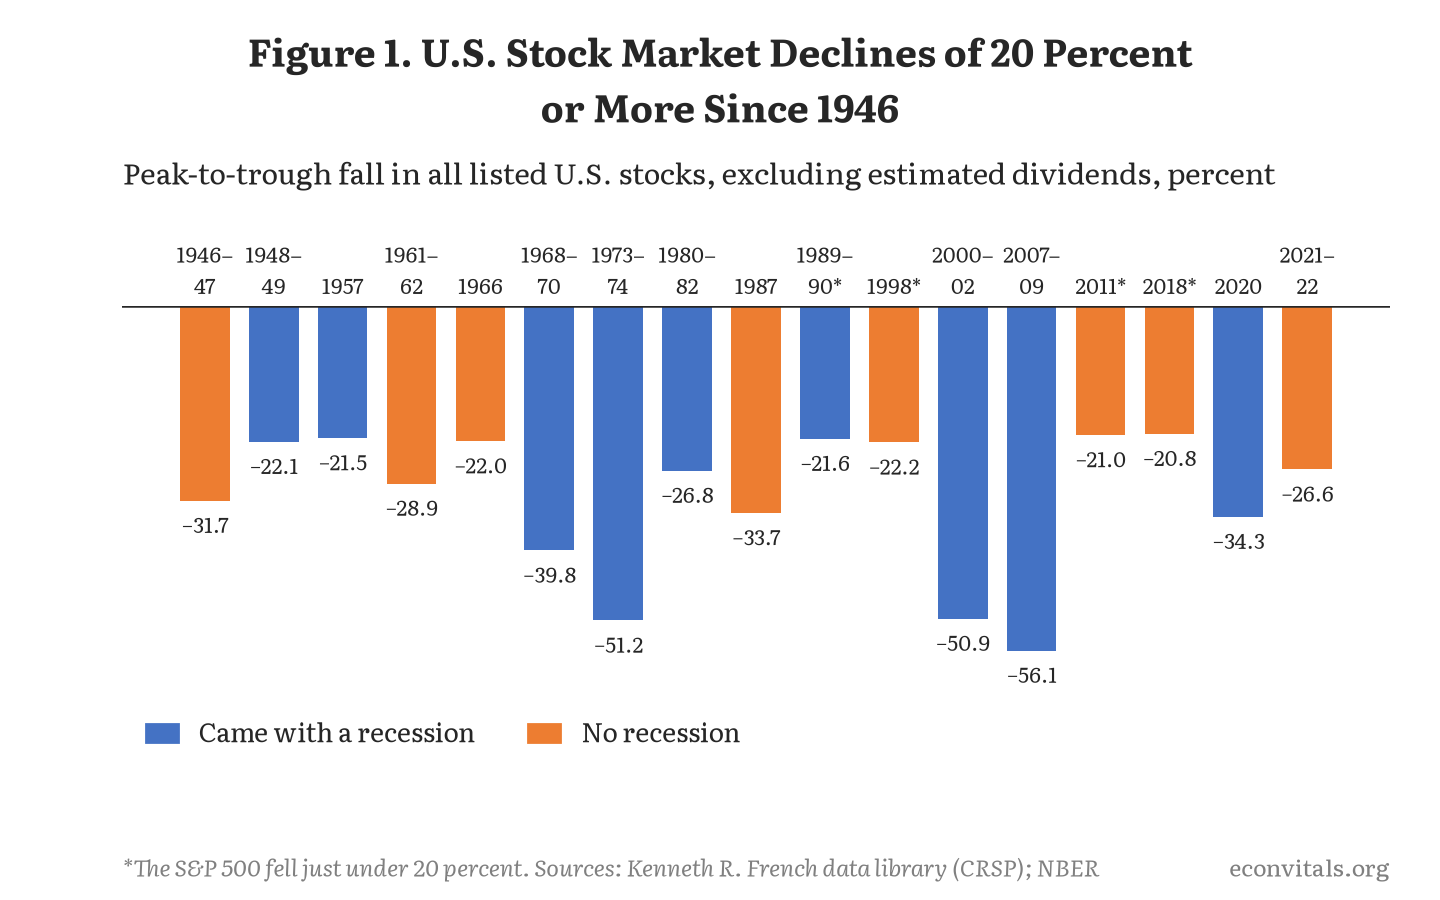
In almost every case the market fall and the recession arrived at roughly the same time—the stock market decline was more a coincident indicator of recession than a leading indicator. Many of the stock market declines were not the cause of the recessions but instead were caused by the same forces that brought the recession. To take an extreme example, the big decline in the market in 2020 did not cause the COVID recession; both were caused by the pandemic.
One of the most clear-cut exogenous declines in the stock market was the 20.5 percent fall in the S&P 500 on October 19, 1987—a seemingly random event triggered in part by the release of worse-than-expected data on the trade deficit. In the year following that decline, real GDP grew 3.8 percent and real consumer spending grew 4.6 percent. (It helped that the Fed immediately said it stood ready to provide liquidity, and that the market had risen nearly 40 percent earlier in the year, but those are precisely the type of factors that could be operative if a bubble bursts today.)
As an aside, the stock market is not the only source of wealth. Housing is even more important for the majority of households and also affects consumption. Since 1976 the correlation between real changes in stock prices and house prices over a year has been just 0.16, and nominal house prices fell in only one of the ten big stock declines since 1980 shown in Figure 1 (2007–09), though adjusted for inflation they also fell substantially in 1980–82 and 1989–90. As a result, the hypothetical scenarios in this post just model stock market declines without considering any propagation or mitigation through the housing market.
Consumer spending held up after the 2001 bubble burst
The common analogy for the current situation is the dot-com bubble, which burst starting in March 2000, with the market falling by half and a mild recession starting a year later—followed by a painfully slow jobs recovery. That recession, however, was primarily about a dramatic reduction in investment: real business investment fell for eight straight quarters, dropping 12 percent from the end of 2000 to the end of 2002. Consumer spending slowed but it never went negative: during its worst four quarters it still grew 1.8 percent.
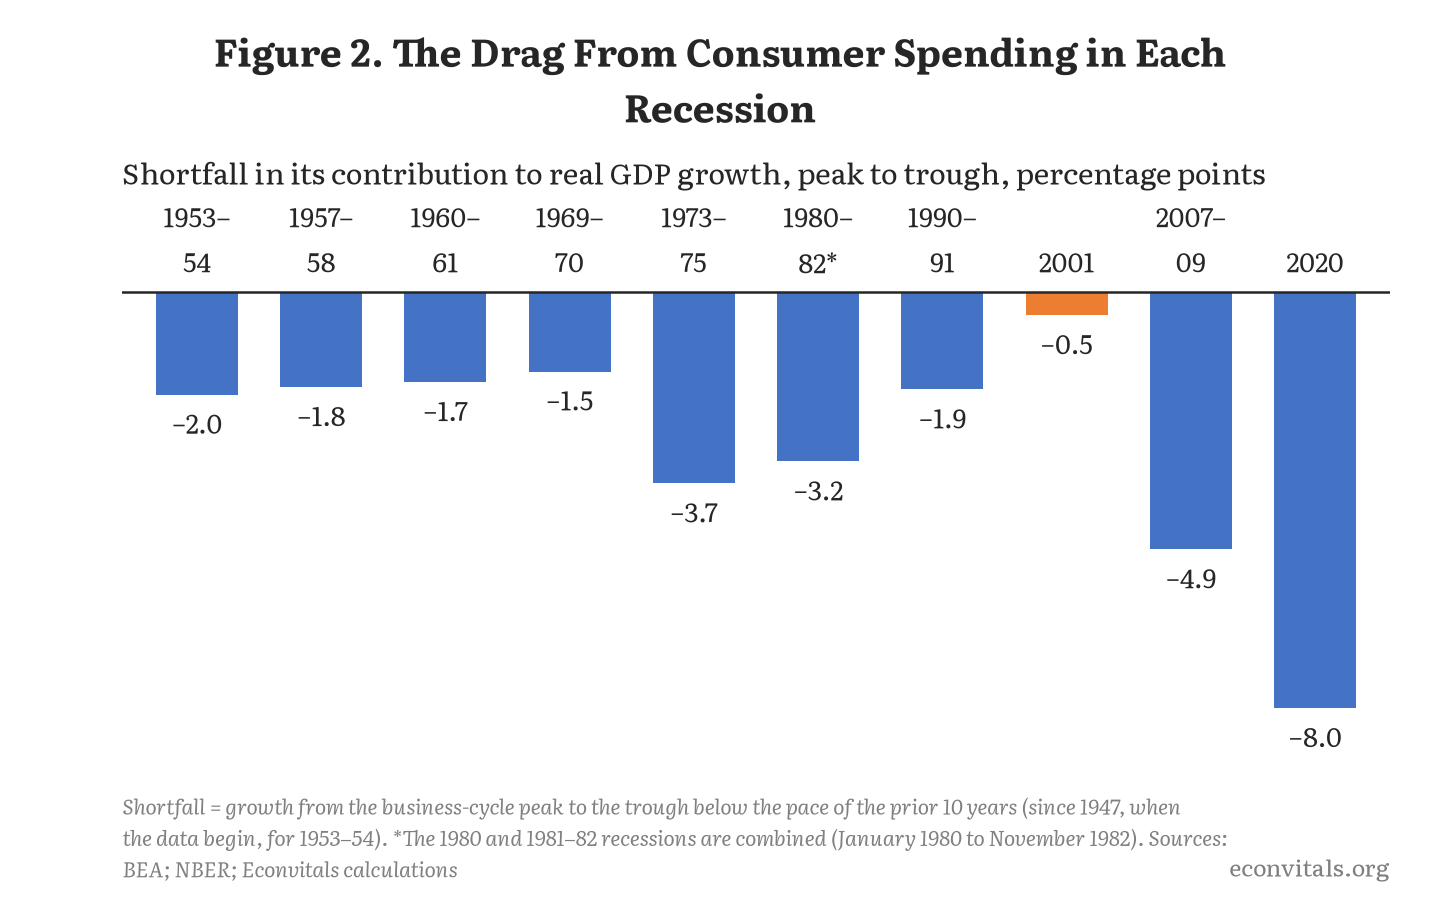
In fact, the 2001 recession is the only recession since 1950 in which consumer spending subtracted less from growth than business investment did (counting the back-to-back 1980 and 1981–82 recessions as one), accounting for only 21 percent of the shortfall in output growth—compared with 44 percent in the median of the other postwar recessions. Moreover, the absolute drag from consumer spending in 2001 was smaller than in any other postwar recession, as shown in Figure 2: only 0.5 percentage point, compared with a median drag of 2.0 points in the other recessions. (Note, you can see these plus many more comparisons of the sources and consequences of post-World War II U.S. recessions on the new Econvitals Recession Explorer.)
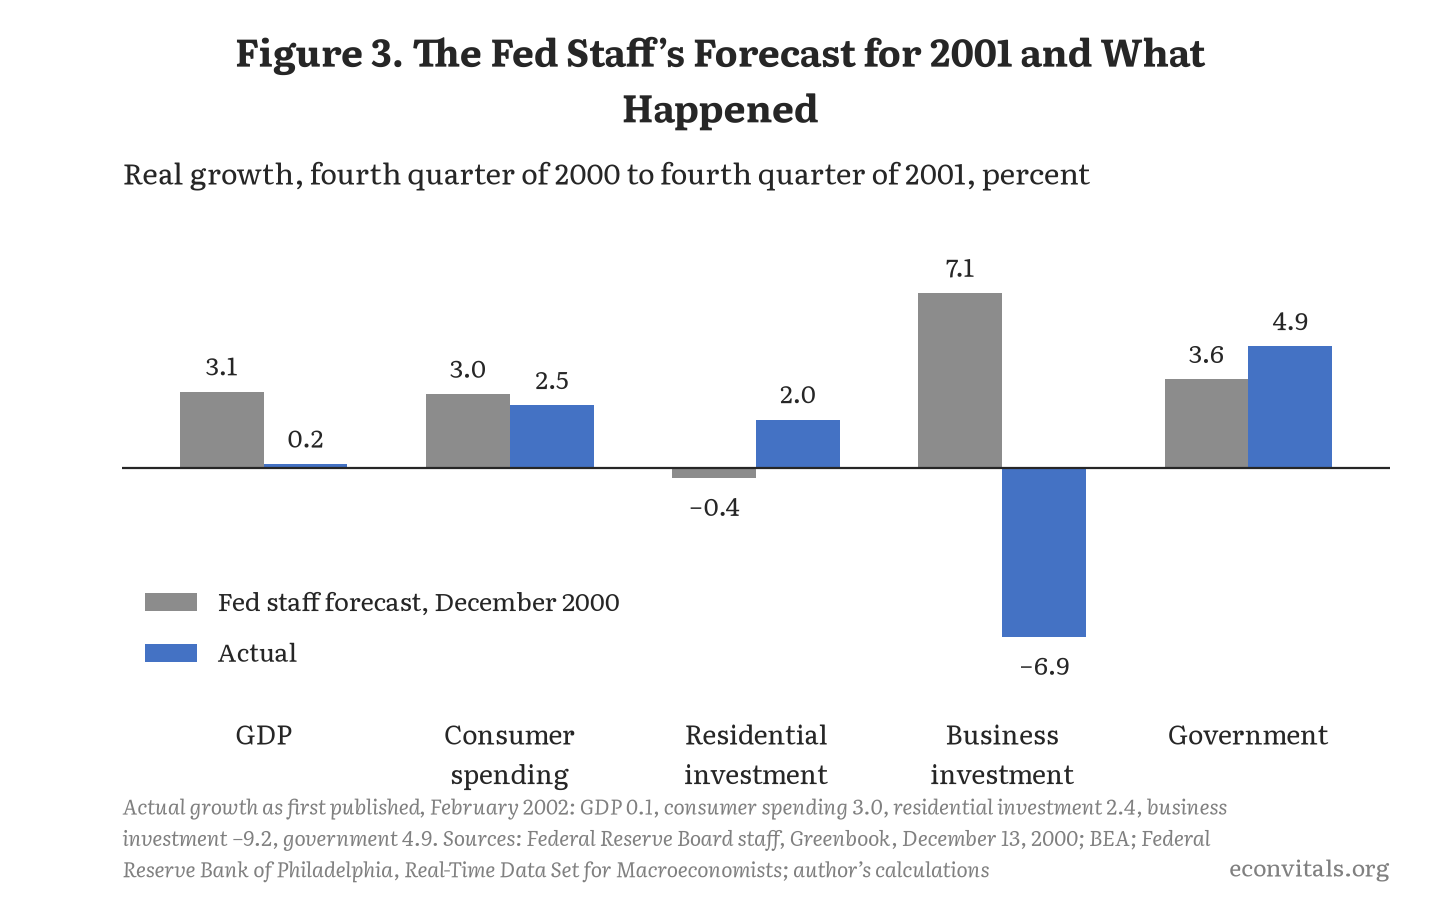
The surprise that drove the 2001 recession was almost entirely in investment. In December 2000 the Fed staff had already marked down its forecast for consumer spending “as the effects of the lower stock market feed through,” and consumers did about what the staff expected: it forecast 3 percent growth in 2001, and spending grew 2.5 percent according to the latest data. It expected business investment to grow 7.1 percent; instead it fell 6.9 percent, as shown in Figure 3.
(And note, this slowdown in consumption spending growth is not a clean test of the wealth effect. Spending was held back by more than stocks: unemployment rose from 3.9 percent at the end of 2000 to 5.7 percent a year later, and 9/11 shook confidence. On the other side several factors helped spending: the Fed cut interest rates from 6.5 percent to 1.75 percent, housing wealth rose and the government sent tax rebates to households. Of course many of these same mechanisms could be expected if there is another large fall in stock prices—so the clean wealth effect is probably not the right prediction for what would actually happen.)
The biggest risk if there is a bubble that bursts is that the stock market is much bigger today…
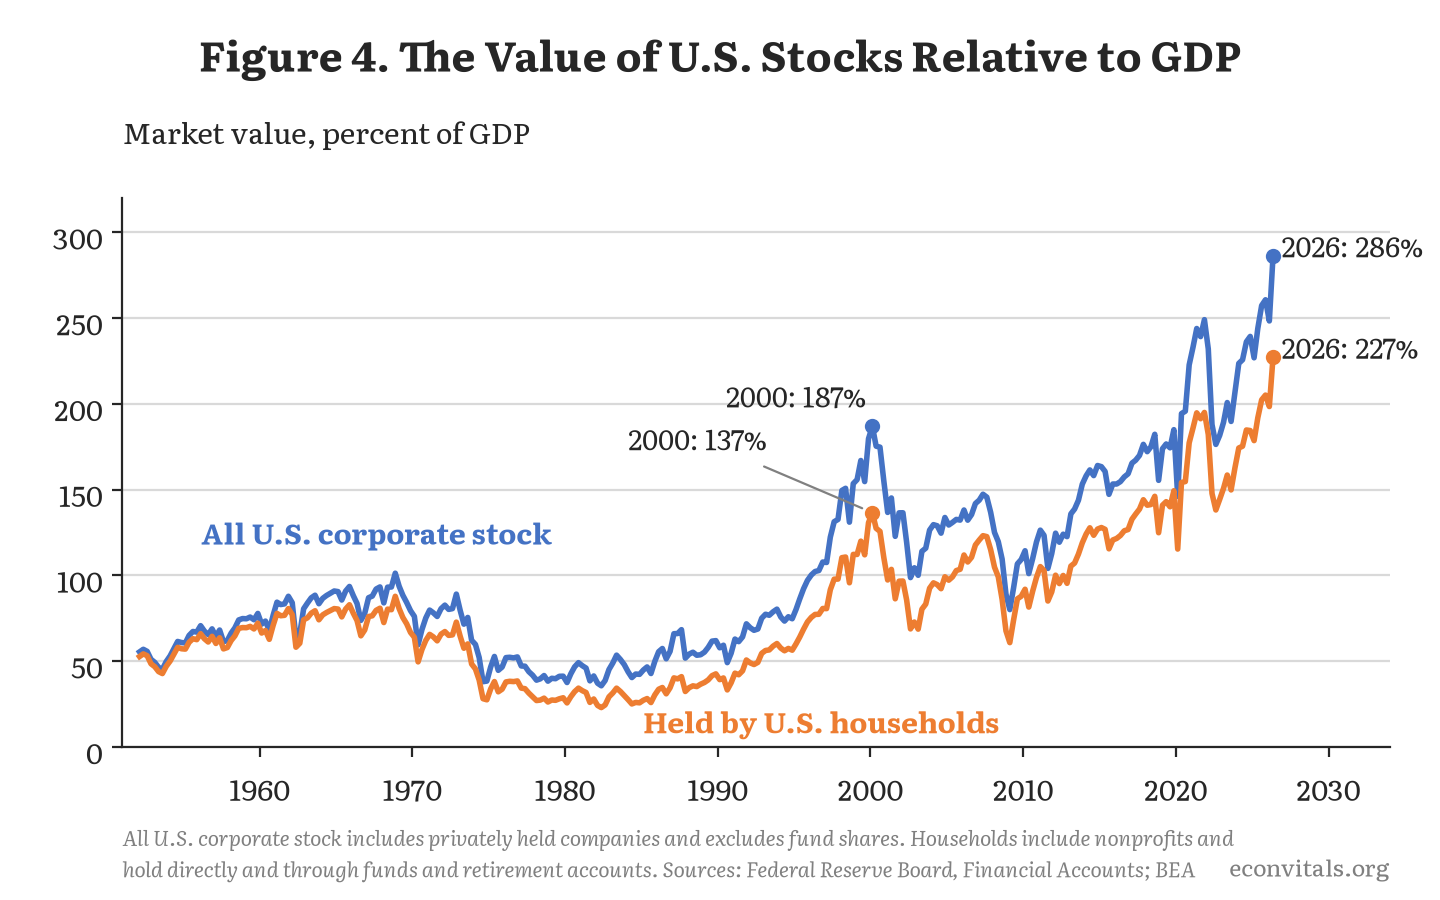
The total value of the U.S. stock market has grown from an average of 65 percent of GDP from 1952 to 1995, to 187 percent at the peak of the dot-com bubble in early 2000, to a record 286 percent in the middle of 2026, as shown in Figure 4. At the same time, an increasing share of the U.S. market is held by foreigners—from 8 percent in 2000 to 24 percent in 2026. But even the stock held by U.S. households, directly and through mutual funds, 401(k)s and IRAs, is much higher than it was in 2000, rising from 137 percent of GDP to 227 percent of GDP. (The household figure includes the foreign stocks Americans own, so it is not simply the part of the U.S. market that foreigners do not own.)
Part of the increase reflects the increased internationalization of the stock market. U.S. companies earn a lot of their profits abroad, and those profits show up in their stock prices but not in U.S. GDP. Mickey Levy estimates that about one-third of the revenues of S&P 500 companies come from abroad, and an even higher share of their profits. Another cause is higher profits at home as income has shifted from labor to capital. Finally, multiples on earnings have increased—which could be a sign of a bubble.
Regardless of the causes, the fact is that a 25 percent decline in the stock market today would wipe out about as much household wealth, relative to the size of the economy, as the halving of the market did after 2000: about 57 percent of GDP if foreign shares fell as much as U.S. ones, compared with the 61 percent households actually lost from early 2000 to late 2002. That is the best case for worrying.
…But households have spent only about 1 cent of every dollar of their recent stock gains
Historically people have increased their spending by about 3 cents for every $1 increase in their stock wealth (e.g., see this study by Gabriel Chodorow-Reich, Plamen Nenov and Alp Simsek). There is no clear evidence that the effect is larger or smaller when the stock market is falling than when it is rising. The evidence on whether the wealth effect was shrinking over time is also mixed and uncertain (see the online appendix by Claude for a literature review).
In the current stock market boom, however, it appears as if people have spent something more like 1 cent of every dollar of their gains—and possibly even less. This is very different from the housing bubble where people made purchases and leverage decisions based on the expectation of continued house price appreciation. If anything, it is as if people have either not had time to ratchet their spending up or are nervous enough about it lasting that they have been conservative in their spending.
The idea that people are being prudent and conservative with their spending may seem at odds with headlines about increasing financial stress, for example rising delinquencies, as people have tried to maintain consumption in the face of rising prices. The way to square the two is to note that much of consumption, and even more of wealth, is concentrated among households at the very top. In mid-2026, the top 0.1 percent of households owned 25 percent of the stock and mutual funds households hold outside 401(k)s and pensions—up from 15 percent in 1989—and the top 10 percent owned 88 percent.
To take an extreme example, according to Forbes the wealth of the 10 richest Americans in fall 2026 is $2.5 trillion higher than it was in fall 2019. While we do not have data on their consumption, I am willing to bet they did not increase their annual consumption expenditures by $7 billion each (which is 3 percent of their average wealth gain). Similarly, if the market crashes, they will not cut their spending by anything like that amount.
So let’s dive into the 1-cent number. There are four complementary ways to get at it:
- A simple back-of-the-envelope calculation: Before COVID, from 2015 to 2019, consumer spending averaged 90.5 percent of disposable income. So far in 2026 it has averaged 91.6 percent—about 1 percent of income higher. Over the same period, the stock that households own rose from 1.8 times their annual income to 2.8 times—an increase worth about a full year of income. An extra year’s income in stock wealth bringing an extra 1 percent of income in spending is 1 cent per dollar—and probably less, since home values rose too. I use the five years before COVID rather than a single year because single years can mislead: 2019 had an unusually high saving rate and 2022, as people spent down their pandemic savings, an unusually low one. If you average over longer periods you get a similar or even smaller answer. (You can see other options for this comparison in the online appendix.)
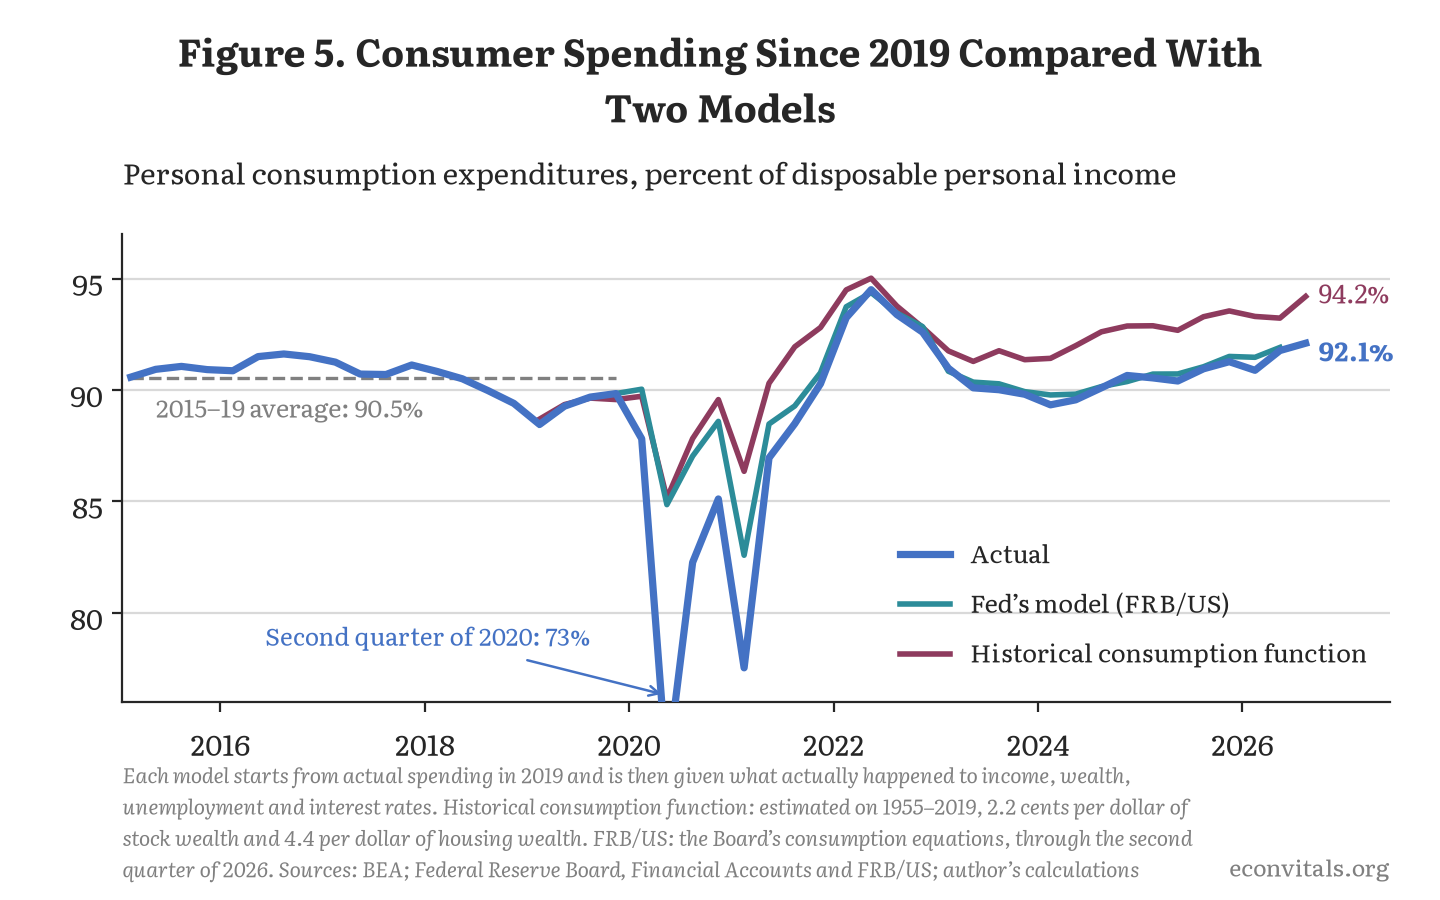
- The Federal Reserve’s model has a wealth effect of roughly 1 cent per dollar—and it matches post-COVID consumption data well. Figure 5 shows the prediction of the Federal Reserve’s FRB/US large-scale macroeconomic model, which is what I used in the first post in this series. The model has a marginal propensity to consume out of wealth of 0.9 cents per dollar in the short run and 1.4 cents in the long run. Its prediction is within a fraction of a percent of actual spending in 2026—which suggests it could be a reliable basis for predicting what would happen if the bubble bursts. If anything, it suggests FRB/US could overstate the wealth effect on the way down because it still overpredicted cumulative consumption on the way up—with households never making up for the spending they missed during COVID.
- The prediction from a simple consumption function: Figure 5 also shows actual consumer spending against what a simple consumption function predicts—one that relates spending to income, wealth, unemployment and interest rates, estimated with data from 1955 to 2019 (it is explained more in the online appendix; it puts the marginal propensity to consume at about 2 cents out of stock wealth and 4 cents out of housing wealth). Actual spending is well below what this model predicts assuming households were in equilibrium in 2019: the actual spending rate is 2.1 percent of income lower than predicted, or $510 billion a year. Assuming instead that spending was in equilibrium on average from 2015 to 2019, the shortfall is 3.6 percent of income, or about $870 billion. The cumulative prediction errors are even larger because consumers never made up for all of their reduced consumption during the pandemic (adding up to about 15 percent of a year’s income since the start of 2020). Adjusting the 2-cent marginal propensity to consume out of stock wealth prediction for these prediction errors takes it down to 1 cent or lower.
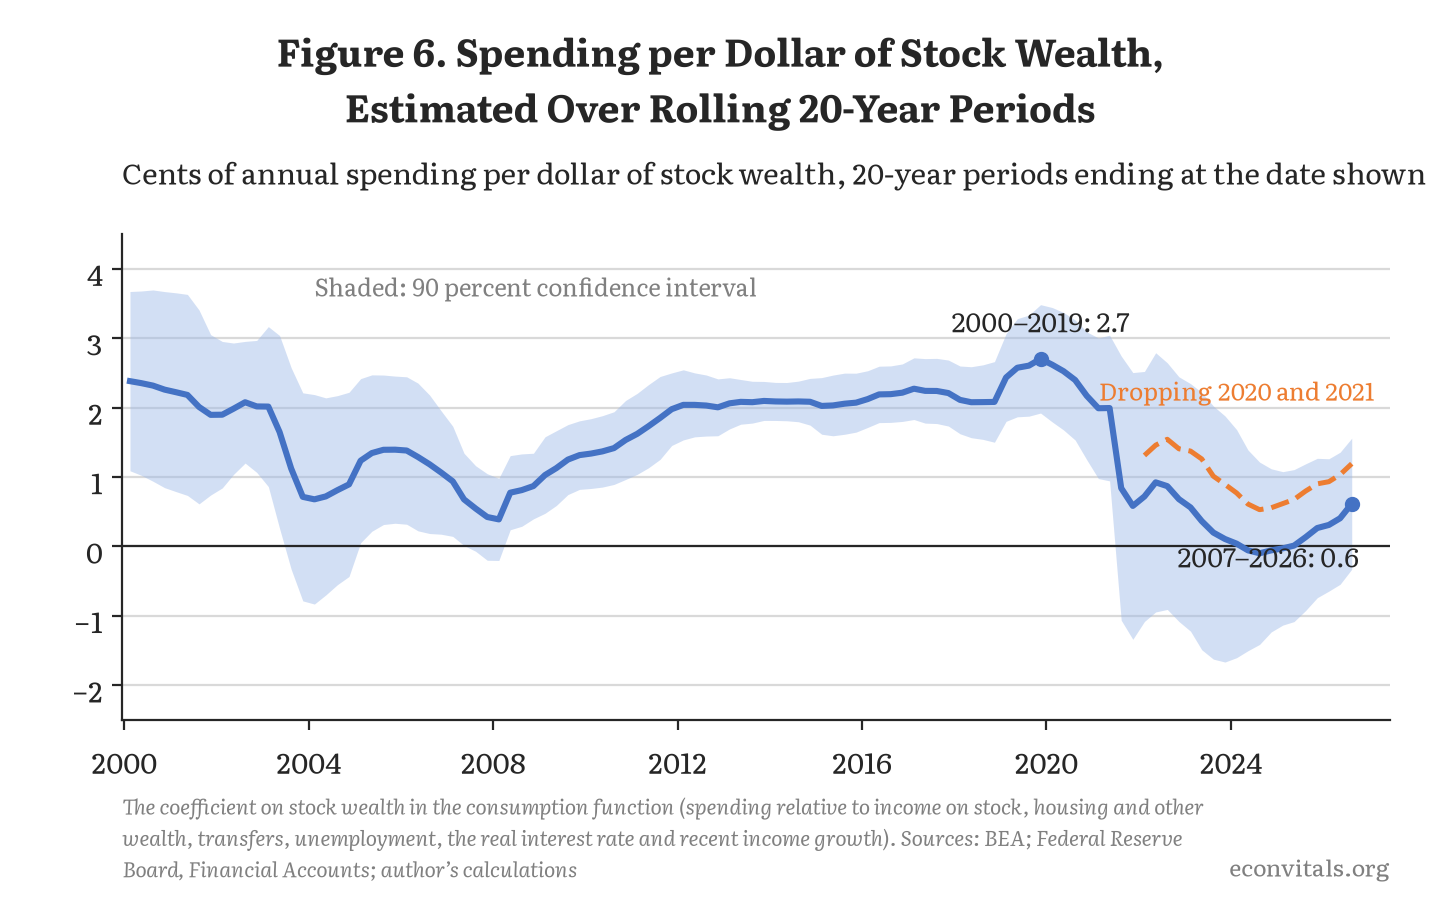
- Estimates of the marginal propensity to consume are much lower once the years since 2019 are included. If you estimate the same consumption function over rolling 20-year periods, the marginal propensity to consume out of stock wealth was about 2 to 3 cents in the periods ending between 2012 and 2019—but when you include data after 2019 it falls precipitously, to only 0.6 cents for the 20 years ending in 2026 (1.2 if you exclude 2020 and 2021), as shown in Figure 6.
How much would a bubble burst affect GDP?
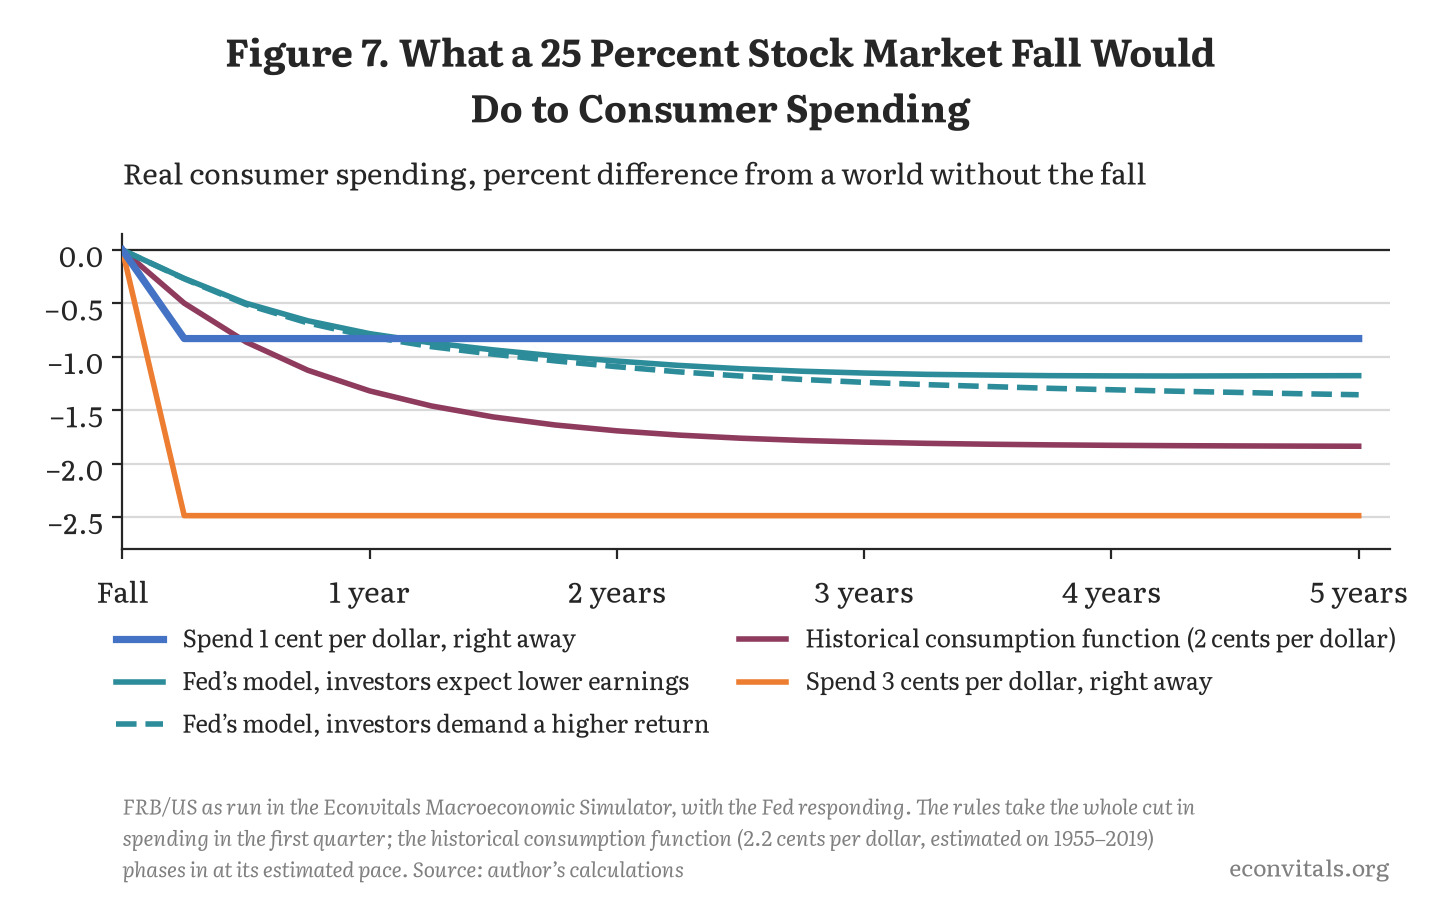
All of this is a long way of saying I would not assume that stock declines take 3 cents off consumption for every dollar that is lost. Using the FRB/US model or a 1-cent marginal propensity to consume roughly matches the recent data—so is a reasonable and possibly even conservative guide to what would happen if the stock market falls. The consumption function I estimated based on data through 2019 is also reasonable, although the fact that actual consumption has risen less than it would predict suggests that it could fall less than it would predict. I also show a 3-cent rule of thumb as a downside risk case—it is certainly reasonable to consider the parameter that has historically governed behavior in the face of wealth shocks.
Table 1 at the top of this post puts these pieces together under the three stock market decline scenarios. Figure 7 shows the time series impact on consumption for a 25 percent decline in the stock market under the different assumptions—and you can see many more versions of the FRB/US simulation on the Econvitals Macroeconomic Simulator.
The bottom line, so far
If the stock market is a bubble that falls by 25 percent, then a decline in consumption of about 0.8 percent over the next year is plausible—which would mean about a 0.6 percentage point reduction in GDP growth assuming no other economic changes. Cutbacks in historic levels of business spending on data centers and the other pieces of the AI buildout would further hurt growth—but probably by only about 0.3 percentage point, as discussed in the first post in this series, much less than the drop in investment itself, because about three-quarters of that spending is imported.
This analysis leaves out two other factors. The first is the degree to which other problems in the financial system—including in credit markets and banks, bank runs, capital flight or just a general increase in the risk premium—could reduce lending to other sectors, greatly exacerbating the data center investment reduction and consumer spending reductions. On the other hand, shock absorbers like monetary policy, fiscal policy and a shift in activity to other sectors—like housing—could mitigate the economic damage. The next two posts in this series consider these issues.
Data Disclosure
Note: This post was written by Jason with title, edits and fact checks by Claude. The data work was done interactively with Claude. An online appendix by Claude has a literature review and the details of the estimates. A replication package is available on Econvitals.

This blog post was originally published on PIIE senior fellow Jason Furman's Econvitals.org website and republished here with permission. Furman wrote the blog post with assistance from AI (see his website for details).