
President Donald Trump announced Aug. 1 he had ordered the firing of BLS Commissioner Erika McEntarfer, claiming the job numbers issued that day “were RIGGED in order to make the Republicans, and ME, look bad.” With that, revisions to the monthly jobs estimates moved from inside baseball for Fed watchers to a front-burner concern for investors and policymakers.
Trump’s announcement came hours after BLS released a monthly employment report showing weaker-than-expected job growth in July and large downward revisions for May and June. Combined with his nomination of E.J. Antoni to replace McEntarfer – a nomination since withdrawn, with no replacement yet named — Trump’s move stoked concerns about potential politicization of the monthly jobs release and other economic data.
Bloomberg Economics has taken a deep dive into the history of revisions to the monthly jobs estimates, particularly with an eye to detecting any evidence of malfeasance. None has been identified.
Our main findings are:
- According to published response rates, BLS is gaining more information than ever before between the first and second estimates of payroll employment.
- Nonetheless, the first revision is no more variable now than it was two decades ago. The absence of any increase in revision variability is a puzzle. Also puzzling: At the monthly frequency, there’s essentially no basis for tying revision variability to response rates.
- Perhaps the most concerning development in recent years has been the sharp decline in BLS’s ability to persuade employers to participate in the monthly survey. This raises difficult questions about whether the monthly sample is truly representative of the overall population.
- Although the establishment survey is not in imminent danger of implosion, several issues demand timely research and innovation, either by BLS itself or in collaboration with outside researchers. This agenda will require an upfront investment of resources rather than the budgetary starvation the Trump administration looks set to deliver.
Overall, the story that emerges from this investigation is a typical one from the messy world of economic measurement: It’s not easy, and constant innovation and relentless transparency are required. The BLS professionals are well positioned to undertake that assignment – but they need the resources and running room to do it.
Three Reasons the Monthly Job Estimates Are Subject to Revision
It’s essential to understand why monthly estimates of payroll employment are revised.
- The BLS asks survey participants to report employment in the pay period that includes the 12th of the month. Generally, the deadline for replies to be included in the first estimate is the Friday before the release date (this means the deadline is usually the last Friday of the month). Some participants don’t make this deadline, but do submit data in time for the second or third estimates. When a survey participant doesn’t submit information, BLS pencils in a place-holder estimate (an “imputation”) of how many employees that company might have had. If the non-reporter later submits its data, that estimate is replaced by the actual value. Because the actual result inevitably will differ from the estimate, a revision results.
- The monthly results are subject to regular calendar-related variation. For example, employment in the retail industry always rises significantly toward the end of the year. This calendar-related variation is generally more nuisance than aid for analyzing the strength of the economy, so BLS provides a version meant to exclude that variation as much as possible. Seasonal variation isn’t perfectly regular, but instead evolves over time. To keep pace with that evolution, BLS uses a procedure called “concurrent seasonal adjustment,” under which they re-estimate the seasonal factors every month. This causes revisions to two months’ worth of seasonally adjusted data, but not the unadjusted data. (Revised seasonal factors for earlier months aren’t implemented until the annual benchmark revision.)
- The monthly results are based on a probability sample of US-based employers, not a census of all employers. As with any sample, the results may stray from what’s going on in the full population. To address that reality, the BLS annually pegs the sample-based estimate of employment to a much more comprehensive tally derived from state records related to unemployment-insurance taxes, a process called “benchmarking.”
A preliminary estimate of the benchmark revision is announced each year in late August or early September. The final benchmark revision is published the following February, and affects both the seasonally adjusted and unadjusted estimates. The totals based on unemployment insurance records aren’t perfect, but they’re widely considered more accurate than the sample-based estimates because they cover the full population of employers who pay into the unemployment-insurance system — more than 95% of jobs in the US, according to BLS. (The BLS is said to invest more effort in cleaning the QCEW data for the first quarter than for other quarters — though this is not readily verifiable.)
Survey Participation Has deteriorated — But Maybe Not as Thought
BLS publishes three estimates of employment in quick succession, roughly one, five, and nine weeks after the close of the month in question. Here’s what BLS reports as the proportion of survey participants who provide data by those mileposts. Technically, these are called “collection rates.”
Figure 1 Response Down for First Estimate, But Not Second or Third
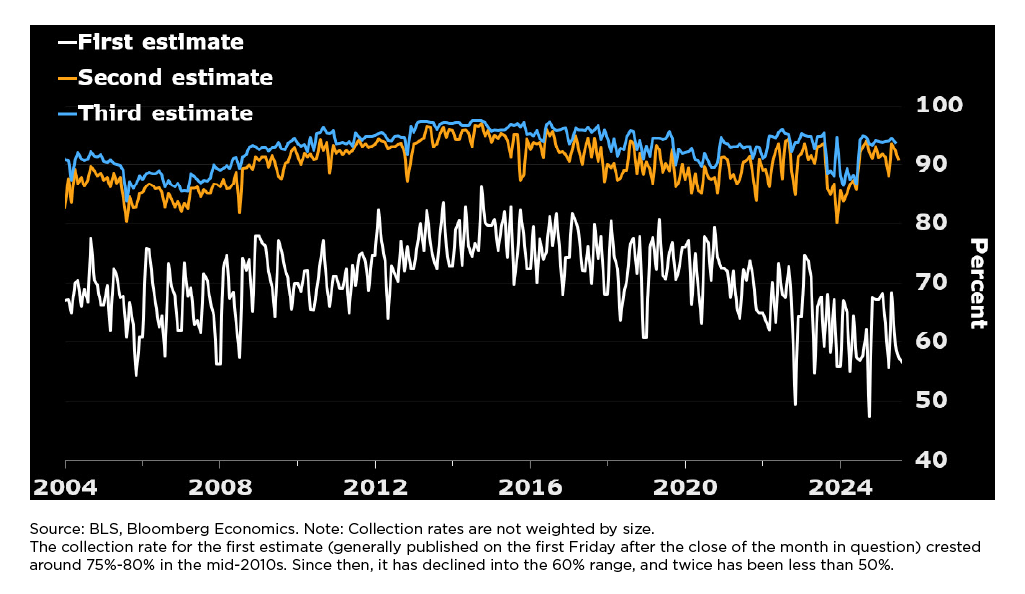
The collection rate for the first estimate (generally published on the first Friday after the close of the month in question) crested around 75%-80% in the mid-2010s. Since then, it has declined into the 60% range, and twice has been less than 50%.
Perhaps surprisingly, the collection rates for the second and third estimates have been much better maintained — remaining in the neighborhood of 90% for the second closing and in the low-90%s for the third closing.
The implications for revisions are most clearly seen by looking at the increases in collection rates from first closing to second, and from second to third.
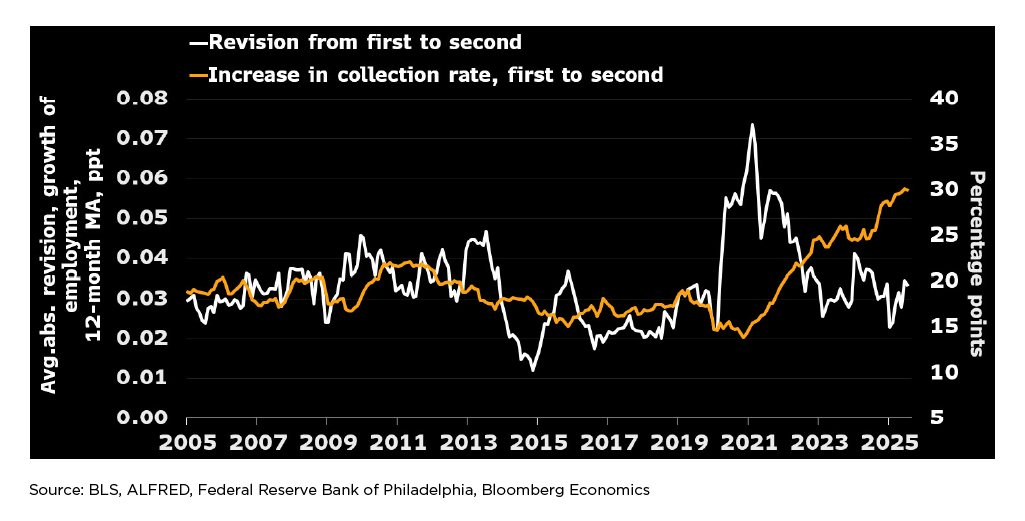
Figure 2 Learning More Now Between First and Second Closings
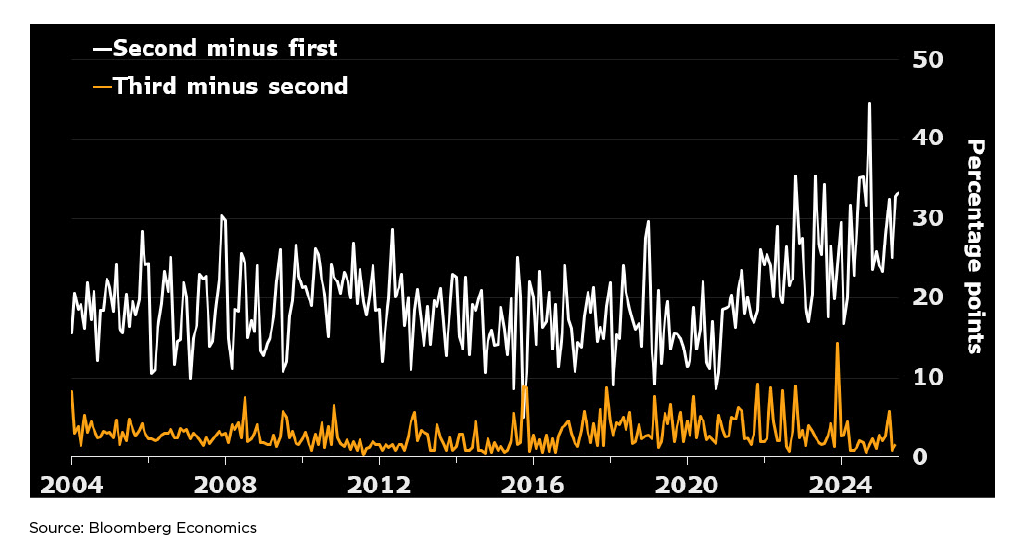
Almost invariably, BLS has gained much more information between the first and second closings (as shown by the white line) than between the second and third (the orange line). This suggests the revisions from the first to second estimate are likely to be bigger, on average, than the revisions from second to third. It turns out this is easily visible in the data, as will be demonstrated below.
The other notable aspect of the chart is that BLS appears to be experiencing a bigger increment to its information set between the first and second closings than ever before in the roughly two-decade-long history of the modern establishment survey. This would suggest revisions from the first to the second estimate might have become larger in the past couple of years – but this appears to be incorrect.
Revision Sizes Have Reverted to About the 2005-13 Average
The best way to examine how changes in collection rates may impact revisions is to look at nonseasonally adjusted estimates of month-over-month employment growth. This approach eliminates any influence from the monthly re-estimation of seasonal adjustment factors and — by looking at growth rates rather than levels — reduces the role of benchmark revisions.
Figure 3 Back to the Old Normal?
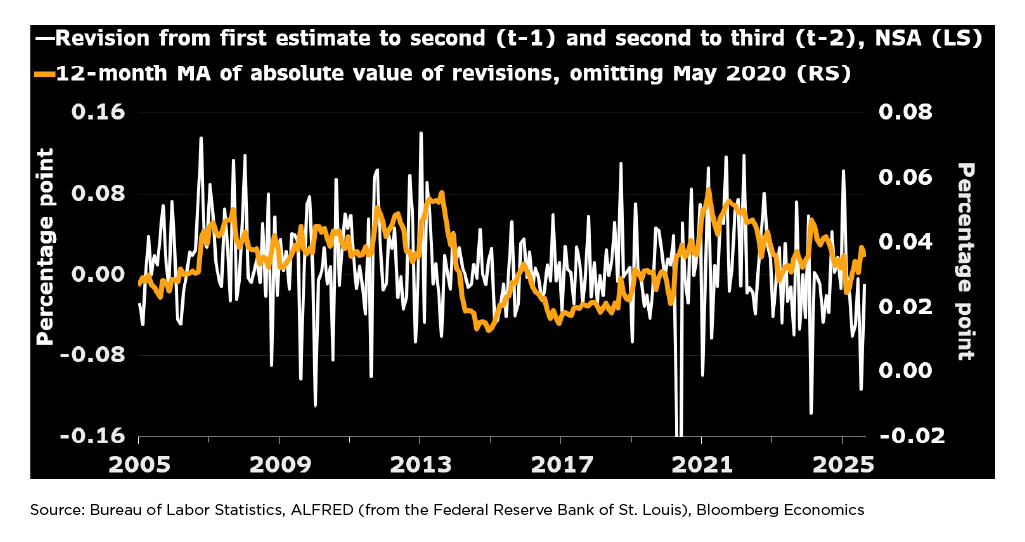
The white line in the graph above shows revisions to the month-on-month growth rate of total payroll employment, as published in each installment of the Employment Situation release. The data shown here combine the first revision to the previous month and the second revision to the month before that. The orange line shows 12-month moving averages of the absolute values of the white line — so the orange line moves up whenever the white line records an unusually large value, whether positive or negative. The orange line is plotted against the right-hand scale.
- From 2005-2013, the average monthly revision (without regard to sign) was generally between 0.03 and 0.05 percentage point (roughly 40,000-70,000 jobs, given the scale of employment at the time). Though larger revisions were common, they were counterbalanced by smaller ones.
- Then there was a tranquil period from 2014-2019 when average revision sizes were roughly half as large. The tranquil period ended with the onset of the pandemic in 2020.
- There was one monstrous downward revision in May 2020 (-0.50 ppt — more than three times as large as any other revision since at least 2004, when the establishment survey’s current structure was put in place). The vertical scale in the graph is truncated to chop off that revision, so it doesn’t ruin the scale for the series. That revision is also omitted from the calculation of the orange line.
- As the pandemic period has faded into the rear-view mirror, the typical size of revisions has simmered down — though it remains larger than the norm during the tranquil period.
- The surprising message of this graph is that revisions driven by late data submissions are no bigger now, in percentage terms, than they were 20 years ago — despite the decline in the first estimate’s collection rate. The reason isn’t clear. (Given the increase in total employment, a typical revision range of 0.03-0.05 percentage point now corresponds to about 48,000-80,000 jobs.)
Larger Revisions Between First and Second Estimates Than Second to Third
The chart below shows the first and second revisions separately, rather than aggregating them. Like the earlier charts, this one is based on nonseasonally adjusted data, and so abstracts from re-estimation of seasonal factors.
Figure 4 First Revision Much Bigger Than Second
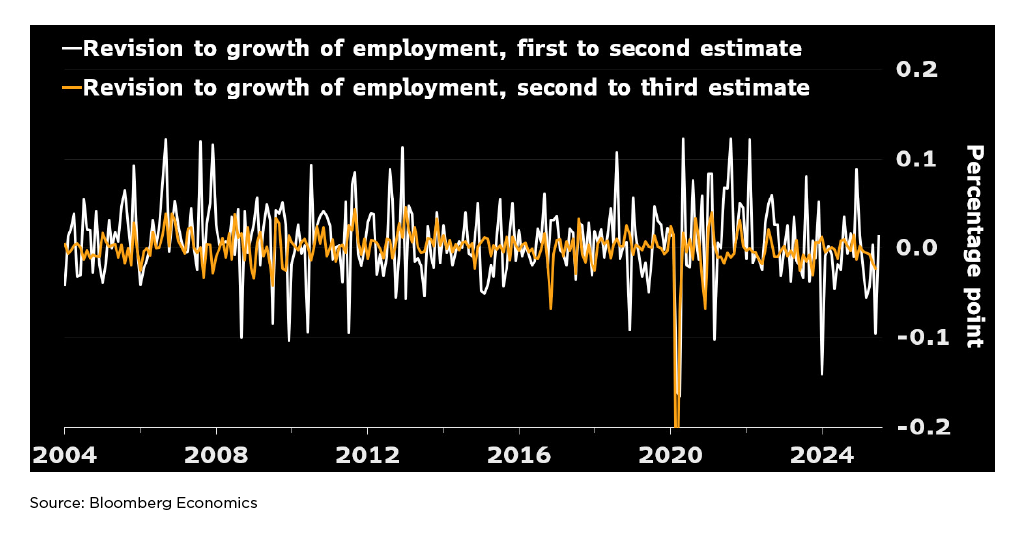
As shown by the greater variability of the white line, the revision from first to second estimate is generally much bigger than the revision from second to third. The one notable exception occurred in March 2020, when there was a huge revision from the second estimate to the third. (This revision was published in the May 2020 employment report, and played a dominant role in causing the outlier noted earlier.)
Thus, the first implication drawn from the chart showing the evolution of collection rates is validated.
Another Look at Puzzling Non-Emergence of Bigger Revisions Lately
The second implication drawn from the chart showing the evolution of collection rates — that revisions from first to second estimate might have become bigger lately due to the decline in the first-estimate collection rate — seems to be incorrect.
The following chart narrows the focus to the first revision only — that’s where the action is in terms of collection rates — and attempts to correlate the size of revisions to the increase in the collection rate from first to second closing.
Figure 5 A Loose Relationship at Best
The solid white line shows the average absolute revision from first estimate to second over the preceding 12 months. The orange line shows the 12-month moving average of the increase in the collection rate from first to second estimate.
From 2005-2019, the two series bear a passing resemblance to one another — but whatever relationship there might have been seems to have broken down with the onset of the Covid pandemic.
Again, the puzzling finding is that the difference in collection rates between the first and second closings has become considerably larger in the past couple of years — yet the average size of revisions between first and second estimates has been about the same as between 2005-2013. Strike one for the hypothesis that there’s a simple relationship between collection rates and revision sizes.
Strike two comes from a cross-plot of monthly readings, not smoothed over 12-month periods:
Figure 6 Pretty Much a Cloud
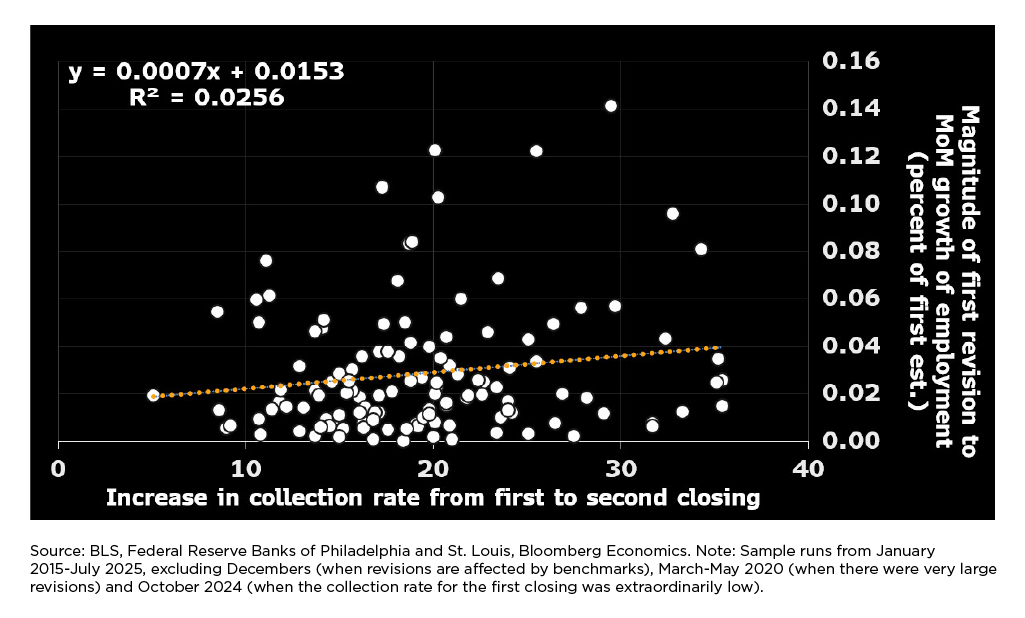
This plot suggests the monthly data offer little to no support for the view that a low collection rate for the first closing tends to foreshadow a larger-than-usual revision in subsequent releases. Given the substantial variation in the reported collection rate for the first closing — 10 ppts of variation being very common — the absence of any material relationship here is counterintuitive. One possible explanation is that the currently available measures of collection rates, which aren’t weighted by size, could be very noisy indicators of the true amount of information in BLS’s possession at any given moment. If feasible, it would be helpful to generate size-weighted versions of collection rates, which could more accurately portray the amount of information BLS is collecting.
An Agenda for BLS Going Forward
These results strongly suggest the monthly revisions to payroll employment reflect the usual business of economic measurement: late receipt of releases, re-estimation of seasonal factors, and annual benchmarking to more-complete source data.
One reason the employment estimates are so valuable is that they’re so timely: The first estimate generally becomes available about three weeks after the period it seeks to measure. If revisions are so troublesome, one remedy would be to delay publication of the first estimate to allow additional data collection. (A recent post by Michael Horrigan, president of the W. E. Upjohn Institute for Employment Research, recommends moving in this direction.) While such a delay would probably reduce revision magnitudes, and deserves consideration, it would not be costless.
Accordingly, the remainder of this section highlights three other aspects of the estimation procedure that deserve serious attention:
- Sample deterioration: The BLS is having increasing difficulty persuading employers to participate in this crucial survey. The percent of employers agreeing to participate and proving capable of doing so (the “initiation rate”) eroded slowly in the second half of the 2010s, before plunging with the onset of the pandemic. It has trended downward since then, lately mostly fluctuating between 25%-35%.
Figure 7 Clear and Present Threat to the Survey
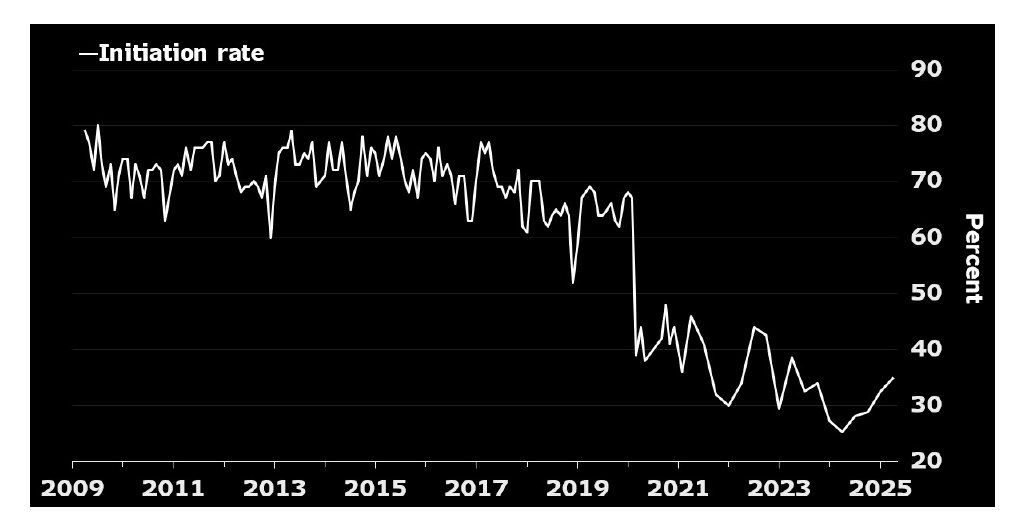
Source: Bloomberg Economics.
The plunge in the initiation rate presents two serious problems for the BLS.
- It increases the cost of conducting the survey. When one firm declines to participate, survey staff need to find another similar firm willing to participate, to keep the sample size at an acceptable level. That search-and-persuasion procedure is much more costly than if the first employer simply agrees to participate.
- It calls into question whether the firms now participating in the survey are truly representative of the population of employers. If two out of three are declining to participate, is the one that does agree different in some unobserved way? With an acceptance rate that low, it’s difficult to dismiss the risk.
Ultimately, the answer to this situation seems likely to involve bringing other data into the mix — a “blended” approach, as many have called it, including William Beach — the BLS commissioner from 2019-‘23 — at this recent event. BLS urgently needs to advance work in this area, as a way of diminishing their reliance on employers’ willingness to participate in voluntary surveys. To accomplish this objective, they’ll need incremental resources up front, allowing them to purchase private data and conduct the research that will be indispensable to demonstrating comparability and reliability.
In the meantime, a careful examination of differences between firms who agree to participate in the CES versus those who decline is warranted. By comparing employment trends in the QCEW between CES participants versus non-participants, it might be possible to gain insight into whether the decline in the initiation rate is as threatening as it appears.
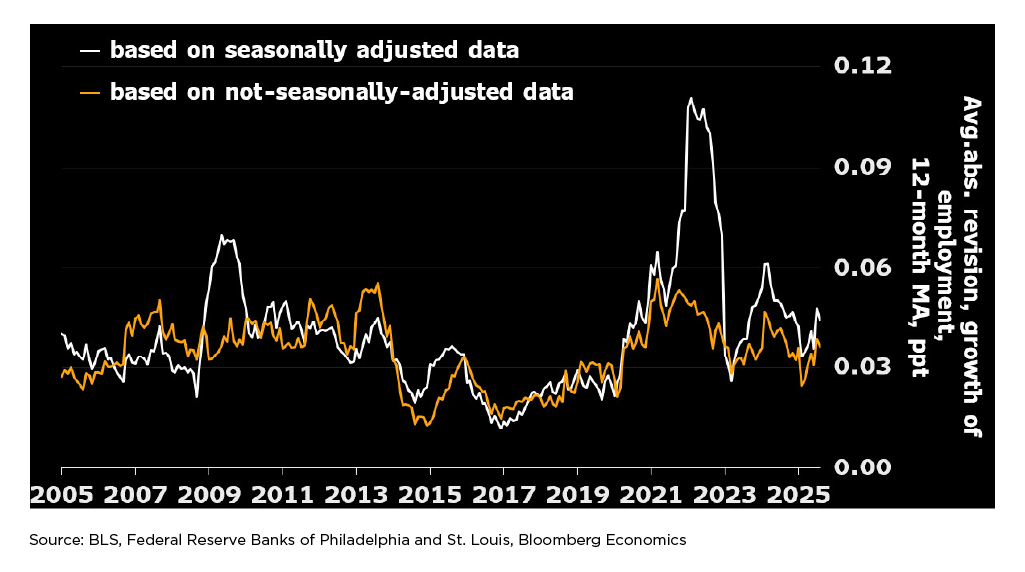
- Seasonal adjustment: In normal times, seasonal adjustment doesn’t add to or subtract much from the variability of revisions. Evidently, that ceases to be true when the economy undergoes a wrenching and unusual change. Such a change has happened twice during the modern incarnation of the establishment survey — once during the financial crisis in 2008-‘10, and again during the Covid-related shutdown and recovery in 2020 and ensuing years.
Seasonal adjustment has been adding much less to the variability of revisions in the past couple of years than it did from late-2021 through early-2023 — but still, revisions in the seasonally adjusted data have remained noticeably bigger recently, on average, than revisions to the NSA data.
Figure 8 Challenges Linger on Seasonal Adjustment
Seasonal adjustment is difficult because it involves decomposing observed fluctuations in the NSA data into calendar-driven variation, and the remainder. In real time, there is no fail-safe method for determining whether a surprising movement in the data represents a change in the normal seasonal pattern for the series in question or a fluctuation that should be allowed to show through into the seasonally adjusted data.
Given that not one but two cataclysmic events have struck the US economy since the turn of the century, it seems time to explore whether modifications to the normal seasonal-adjustment routine should be introduced to detect when the data series has been hit by deeply unusual observations. A productive way to pursue this issue might be to host a conference and invite input from analysts who specialize in this area.
- Benchmarking: Once a year, the BLS aligns the sample-based estimates with results derived mainly from the Quarterly Census of Employment and Wages (QCEW). The QCEW, in turn, is mainly based on filings required under the Unemployment Insurance system. Each February, the BLS pegs the level of employment in the CES from the prior March (11 months earlier) to the level indicated by the QCEW-based framework (with a preliminary estimate of the benchmark revision released the previous September).
The resulting revisions can be substantial, and occasionally can change the perception of the cyclical state of the economy. In September 2025, BLS announced their preliminary estimate of the benchmark revision to be published on Feb. 6, 2026. According to the preliminary estimate, CES employment in March 2025 will be revised down by 911,000 when the final benchmark revision is announced next February. If the actual revision is as large as the preliminary estimate suggests, a couple of recent monthly changes in employment could flip from positive to negative.
Bloomberg Economics thinks the final benchmark revision will be smaller than September’s preliminary estimate. The following graph shows the history of benchmark revisions, measured as a percent of the sample-based estimate of the level of employment before the revision was implemented. It assumes that the revision for March 2025 will be -560,000 — in line with Bloomberg’s current estimate — rather than the -911,000 announced by BLS.
Figure 9 Anything to Be Done to Diminish the Role of Benchmarks?
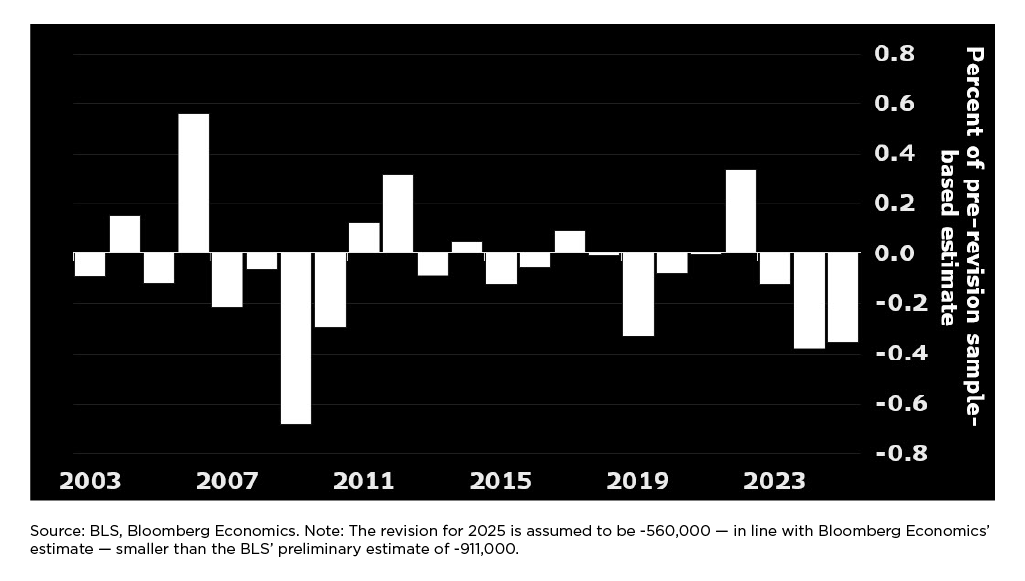
While the two most recent revisions were substantial, they weren’t unprecedented — the ones in 2006 and 2009 were considerably larger. Nonetheless, it’s worth checking if a better method could be developed.
Nothing in this area will be easy, partly because the QCEW data are widely thought to be more accurate in March than later in the year. Some possible avenues of research include the following: With additional resources, would it be possible to invest in cleaning the QCEW data for other months to the same extent as for March? Could the lag in processing the QCEW be reduced significantly from the current six months? Could the creation of new firms be captured more quickly, potentially reducing the role of the bureau’s “birth-death model”? Why do many employers report different employment levels to the CES than the QCEW?
A Brief History of the CES
The modern Current Employment Statistics (CES) system is a surprisingly recent creation brought about by three major developments, all discussed in this authoritative history of the program:
- In 2002, the CES became fully grounded in a probability sample. Before that, because of the absence of a probability design, it was even more difficult to know if the firms participating in the survey were truly representative of the universe.
- In 2003, the BLS began re-estimating seasonal factors every month (so-called concurrent seasonal adjustment). Before then, seasonal factors had been updated annually (1980 through June 1989) and then semiannually (1989 through May 2003). In June 2003, BLS began re-estimating seasonal factors every month, “to incorporate the most up-to-date employment data into these factors.”
- Finally, starting in 2004, BLS began publishing benchmark revisions according to the current schedule. In particular, each February they began publishing estimates where the level of employment for the prior March was pegged to the level indicated in the QCEW-based system. Before then (from 1982-2003), benchmark revisions were mostly released in June. (The exception occurred in 1990, when the benchmark was delayed until September.)
In light of these developments, this study covers the period beginning in January 2004, an era during which the fundamental elements of CES methodology — sampling, seasonal adjustment, and benchmark revision — have all been consistent.
A National Resource Worth Preserving
The BLS estimate of payroll employment is a tremendously useful indicator of the cyclical state of the economy. The first estimate is published roughly three weeks after the period it covers. The sample size is very large, currently comprising roughly 121,000 businesses and government agencies, constituting 26% of the national total.
The establishment survey faces important challenges. Willingness to participate in voluntary surveys is declining both domestically and internationally, and seems unlikely to rebound meaningfully. Seasonal adjustment presents ongoing challenges, especially when upheavals that would have been considered once-in-a-generation seem to occur with disturbing frequency. With an aggressive program of innovation — perhaps enabled by legislation allowing increased data sharing — it may be possible to reduce the size of benchmark revisions.
Improving the monthly estimates of payroll employment is an attainable goal, but will require a sustained commitment of time, attention, and resources. The experts at the statistical agencies need to be allowed to pursue promising leads, and given the resources to do so.
Data Disclosure
This publication does not include a replication package.

© Bloomberg via Bloomberg Terminal. Originally published October 16, 2025; republished with permission. David Wilcox is senior fellow at the Peterson Institute for International Economics and director of US economic research at Bloomberg Economics.