Body
This blog post was revised November 20, 2017, to clarify figure 2.
The Tax Cut and Jobs Act of 2017 (H.R. 1), voted on by the House of Representatives on November 16, 2017, would slash the federal corporate tax rate from 35 to 20 percent. The corporate tax cut would by itself reduce federal revenues by $1.462 trillion over 10 years—about $100 billion for each percentage point of tax cut.[1] H.R. 1 is far from the final word on what Congress ends up passing. Senators are now considering tax cuts and revenue increases in other areas and moving toward adoption of a modified approach, deferring the corporate tax cut to 2019.
But if Congress enacts something that resembles H.R. 1, the competitive standing of US corporations would improve. The current 35 percent statutory rate, when coupled with state taxes that average 5 percent, puts the United States in last place among large advanced economies, from the standpoint of corporate tax rates. Because of various credits, deductions, and “loopholes,” effective average corporate tax rates in nearly all countries (including the United States) are lower than statutory rates. However, compared to other advanced countries, the United States extracts a high effective rate from corporations, especially large ones. A 20 percent federal rate would turn the tax world upside down, putting the United States on par with the United Kingdom, and in the upper third of advanced countries. Multinational corporations that compare tax burdens for their next factory, office, or research and development (R&D) center, will find the United States very attractive.
In an additional tax incentive for businesses (including “passthrough” entities), H.R. 1 allows 100 percent expensing of equipment outlays for the five years starting in 2019, an increase from the current allowance of 50 percent bonus depreciation (phased out in 2019). In other words, under H.R. 1, all equipment purchases can be deducted as an expense from business income between 2019 and 2023. The revenue cost of this incentive is estimated at $25 billion.
Partly to pay for the rate cut and expensing, H.R. 1 would claw back some $293 billion[2] in tax revenue from multinational corporations’ profits retained abroad since 1986. The legislation proposes to collect another $77 billion over the next 10 years from multinational corporations that enjoy high returns in their subsidiaries abroad. The original version of H.R. 1 proposed an additional $155 billion of “excise” taxes on foreign parent or sister corporations of US firms.[3] However, the subsequent Chairman’s Amendment allows 80 percent of foreign taxes on the relevant income to be credited against this tax, bringing the new revenue estimate down to $88 billion.[4] All told, US multinational corporations would be taxed an additional $458 billion over 10 years as a result of these steps. The aim of the authors of the legislation is to help pay for the rate cut and expensing provisions. On the other hand, future dividends from foreign subsidiaries would be exempt from US tax (apart from “high return” subsidiaries), at a revenue cost of $205 billion over 10 years.
Arguments from the Critics
Proponents of the legislation say that with lower tax burdens, corporations will become more productive, hire more workers, and sell more of their products at lower prices in the United States and abroad. Opponents have raised a number of objections, however.
More debt. The loudest criticism has been leveled by deficit hawks, who argue that the additional $1.5 trillion in public debt accumulating over the next decade, as a result of the corporate tax cuts, would increase the deficit and interest rates, impeding economic growth and placing a burden on future taxpayers paying it off. (By some calculations, the debt would increase by more than $2 trillion.) This criticism, however, has been made by some of the same economists who argue for more deficit spending to address what they say is an era of “secular stagnation” in the US economy. The “secular stagnation” forecast envisages a decade or more of slow productivity gains, low interest rates, and tepid GDP growth—all supposedly impervious to government action. The only possible cure, according to apostles of stagnation, is prolonged fiscal stimulus.
But stimulus is just what H.R. 1 would provide. Suppose H.R. 1 costs as much as $2 trillion, but raises annual labor productivity growth from 1.1 percent (the record of the past decade) to 1.3 percent, and boosts annual real GDP growth from the 1.8 percent forecast of the Congressional Budget Office (CBO) by just 0.2 percent, to reach 2.0 percent annually—a modest and highly plausible outcome if the tax cut succeeds in stimulating annual investment by 1.0 percent of GDP or more.[5] In that scenario, H.R. 1 would be a bargain: Cumulative GDP between 2018 and 2027 will be $2.7 trillion larger than the CBO forecast, a payoff exceeding the additional debt of $2 trillion.[6]
By contrast with this scenario, many critics believe that additional public debt will drive up interest rates enough to throttle the tax stimulus to investment. In other words, they depart from a key aspect of the secular stagnation scenario when it comes to evaluating the Republican business tax proposals.
More regressive. Another criticism is that H.R. 1 would weaken the progressive nature of the US tax system, rewarding wealthier taxpayers at the expense of burdening some in the middle class. Recent trends have, for various reasons, benefitted the top 1 percent of earners, who commanded 22 percent of pre-tax US income in 2015, compared to 10 percent in 1960.[7] To be sure, the tax system slices the after-tax share of the top households: Under current law, the top 1 percent paid 39 percent of individual taxes and earned 21 percent of adjusted gross income.[8] These distributional facts will not change much if H.R. 1 is enacted: According to the liberal Tax Policy Center, which is supported by the Brookings Institution and the Urban Institute, the overall change in federal taxes in 2018 is a decline of just 1.3 percent, with not much more going to the top 1 percent than the median household. The evidence suggests that critics who charge that H.R. 1 is Robin Hood in reverse, taking from the middle class and giving to the rich on a large scale, are overstating the case.[9]
The core distributional complaint is centered on corporate taxes, not individual taxes. In the view of critics, lower corporate taxes overwhelmingly benefit shareholders and other owners of capital—predominantly upper income households. Indeed, the Tax Policy Center, which has long argued for higher taxes on the wealthiest Americans, assumes that 80 percent of the corporate tax cut accrues to owners of capital.[10] Building on that assumption, the top 1 percent enjoys a tax cut of 1.7 percent in 2018 while the middle quintile only gets 1.3 percent. With such assumptions, it is not surprising that believers in tax progressivity and skeptics of the sponsors’ growth calculations (often the same people) show no affection for H.R. 1.[11]
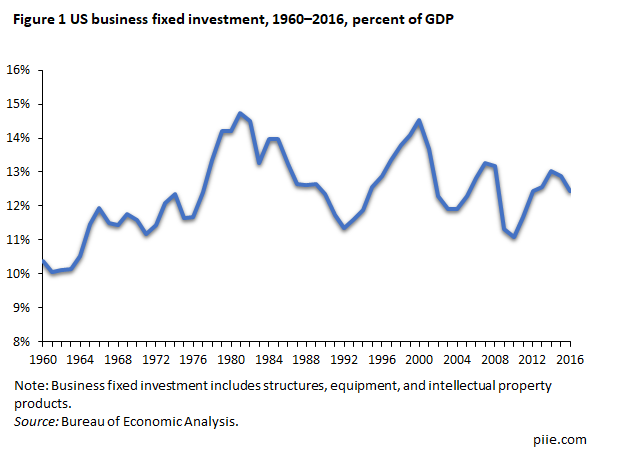
No investment payoff. The conservative Tax Foundation estimates that H.R. 1 will increase the US capital stock by 10.6 percent in the long run. But some commentators are skeptical that corporate tax relief will permanently boost the share of GDP devoted to investment.[12] As figure 1 shows, US domestic business fixed investment (including R&D) has been stuck around 13 percent of GDP for decades. Empirical studies reach a range of conclusions about the impact of taxes on investment.[13] For example, Mooij and Ederveen (2003) surveyed 25 empirical papers and concluded that a 1 percentage point decrease in the tax rate (e.g., a decrease from 25 to 24 percent) would increase the annual inflow of foreign direct investment by 3.2 percent.[14]
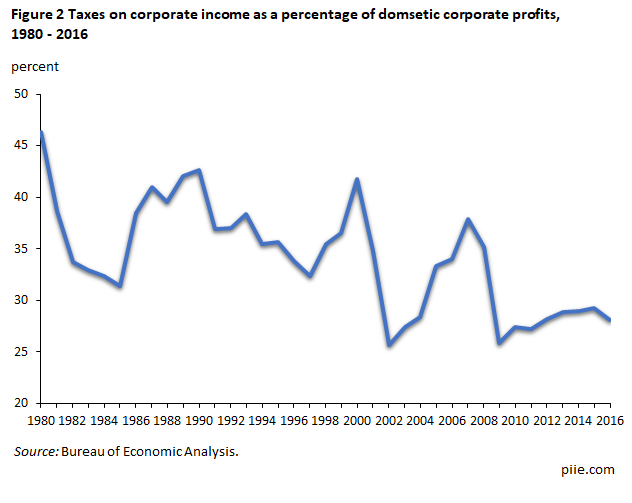
On the other hand, some authors cite the US experience following the 1986 tax act, which cut the statutory corporate rate from 46 percent to 34 percent but saw no leap in investment. But since the 1986 act repealed several business deductions and credits, the average effective corporate tax rate on domestic profits rose, as shown in figure 2. That could explain the fall in investment as a share of GDP in the late 1980s.
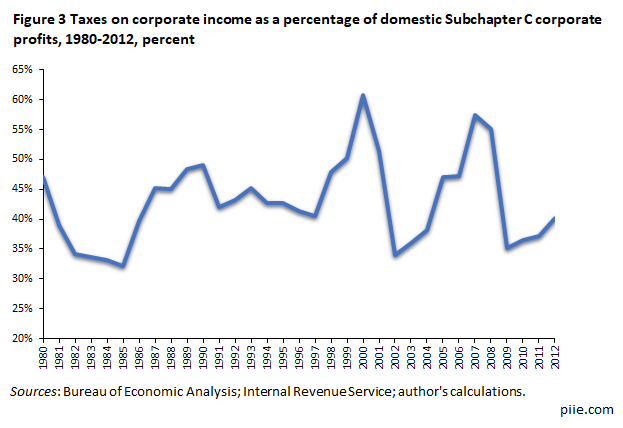
Figure 2 indicates that taxes on corporate income expressed as a percentage of domestic corporate profits have declined over recent decades, but this is misleading. Domestic corporate profits reported by the Bureau of Economic Analysis (BEA) in figure 2 include earnings of both Subchapter C corporations and Subchapter S corporations. Only Subchapter C corporations are taxed at corporate tax rates (35 percent federal statutory rate plus state taxes), while Subchapter S corporations are pass-through entities that are taxed only on the individual returns of the beneficial owners. By subtracting Subchapter S corporation profits from domestic corporate profits as reported by the BEA,[15] the average effective tax rate on Subchapter C corporations alone can be calculated, as shown in figure 3. [16] This tax rate has not exhibited a downward trend over time. Instead, the combined federal and state rate on Subchapter C corporations has bounced around 40 percent over the period 1980–2012.
In any event, debate over the link between tax rates and investment will not be settled before the Congress votes on H.R. 1.


Little wage gain. Advocates of H.R. 1 have pinned a large part of their case on the argument that cutting corporate taxes will yield gains in the wage income of average Americans. Kevin Hassett, chairman of the Council of Economic Advisers, has argued that the gains in the long-run could range from $4,000 to $9,000 per household (measured in 2016 prices). Opponents have dismissed his projections as overstated. Multiple case examples and studies are cited by each camp.[17]
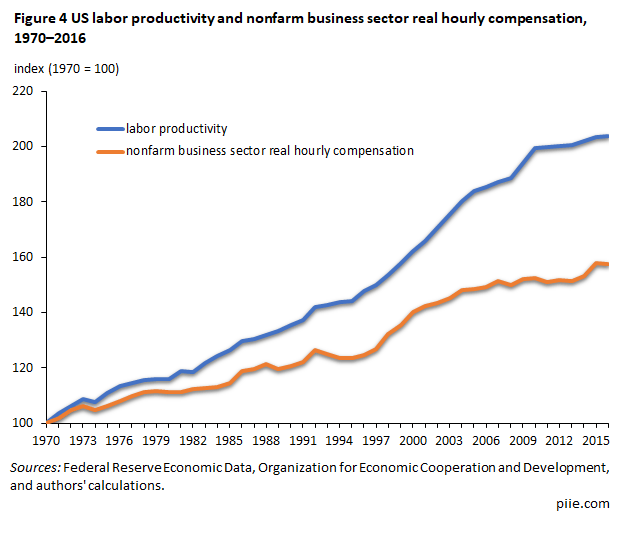
The argument that business tax cuts lead to wage gains depends on three intermediate links: first, between tax cuts and investment gains; second, between investment gains and productivity growth; and third, between productivity growth and wages. But there are reasons to believe that the wage gains will be significant. The link between capital accumulation and labor productivity is a tenet of modern economics, illustrated by the Solow growth model. This link is not controversial. Until 1990, hourly wages almost tracked labor productivity (figure 4), but since 2000 the connection has been much weaker. Possibly the fiscal stimulus implied by H.R. 1 will create the sort of “high pressure” economy that prompts employers to bid up wages to attract more workers. If that doesn’t happen, redistribution policies could become a central feature of the 2020 presidential election.

Data Disclosure:
The data underlying this analysis are available here.
Notes
1 Revenue estimates are from the Joint Committee on Taxation.
2 Revenue estimates are based on an unpublished Joint Committee on Taxation summary of Estimated Revenue Effects of the Chairman’s Perfecting Amendment to the Amendment in the Nature of A Substitute to H.R. 1, As Amended, to the “Tax Cuts and Jobs Act” on November 9, 2017.
3 The structure of the tax in question is very different than familiar excise taxes on alcohol and tobacco. Hence the quote marks.
4 Revenue estimates are from an unpublished Joint Committee on Taxation’s Estimated Revenue Effects of the Chairman’s Perfecting Amendment to the Amendment in the Nature of A Substitute to H.R. 1, As Amended, to the “Tax Cuts and Jobs Act” on November 9, 2017.
5 At a ratio of incremental capital to incremental output as high as 5, additional investment of 1.0 percent of GDP would increase output by 0.2 percent.
6 This calculation assumes an annual GDP inflation rate of approximately 2.0 percent (the Federal Reserve’s target for the index of personal consumption expenditures). Hence, nominal GDP under the CBO forecast grows at 3.8 percent annually (1.8 percent real plus 2.0 percent inflation), while nominal GDP under the alternative forecast grows at 4.0 percent annually (2.0 percent real plus 2.0 percent inflation). CBO forecasts are available at Congressional Budget Office – Budget and Economic Data – 10-Year Economic Projections – June 2017.
7 Emmanuel Saez and Thomas Piketty, "Income Inequality in the United States, 1913-1998," 2003 Quarterly Journal of Economics 118, no. 1: 1–39 (longer updated version published in A.B. Atkinson and T. Piketty eds., Oxford University Press, 2007) (tables and figures updated to 2015 in Excel format, June 2016; table A3 data are on pre-tax cash market income, including realized capital gains and excluding government transfers).
8 Likewise, the top 10 percent of households earned 47 percent of adjusted gross income and paid 71 percent of individual income taxes in 2015. See SOI Tax Stats – Individual Income Tax Rates and Tax Shares – Number of Returns, Shares of AGI and Total Income Tax, AGI Floor on Percentiles in Current and Constant Dollars, and Average Tax Rates.
9 See, for example, the comments of Minority Leader Nancy Pelosi, the op-ed by Lawrence Summers, and the policy brief by the Institute on Taxation and Economic Policy.
10 See Tax Policy Center – Resources – Brief Description of the Tax Model.
11 By sharp contrast with the Tax Policy Center, distributional tables circulated by the Joint Committee on Taxation, indicate that households earning income of $200,000 and over will receive only 18.8 percent of the benefits in 2019 from the business tax provisions of the Senate version of the Tax Cuts and Jobs Act.
12 See, for example, Mark Zandi, quoted in USA Today.
13 See subsections of “tax policies” and the section “How Us Investment Might Respond to a Corporate Tax Cut” in Lessons for US Business Tax Reform from International Tax Rates.
14 Ruud Mooij and Sjef Ederveen, "Taxation and Foreign Direct Investment: A Synthesis of Empirical Research," 2003, International Tax and Public Finance 10: 673–93.
15 Data on income of Subchapter S corporations are from the Internal Revenue Service.
16 The BEA data on domestic corporate profits also includes profits of limited liability corporations (LLCs). Since historical data on the income of LLCs is not available in the IRS database, LLC income has not been subtracted from corporate profits as reported by the BEA.
17 See William Cline's Policy Brief Will Corporate Tax Cuts Cause a Large Increase in Wages?


