In the aggregate, there’s no denying that China’s financial system has changed rapidly over the past decade. While loans previously accounted for close to 100% of all financing to the real economy, their share has currently dropped to barely more than 50%.
Equally striking has been the growth of off-balance sheet financing. Trust loans, entrusted corporate-to-corporate loans, and bankers’ acceptances are the components of total social financing which are most akin to shadow banking because they are less regulated and believed to be more risky. Combined, these products accounted for 30 percent of new financing to the Chinese economy in 2013, a record high.
Shadow Banking Share Total Social Financing (Yearly Flow)

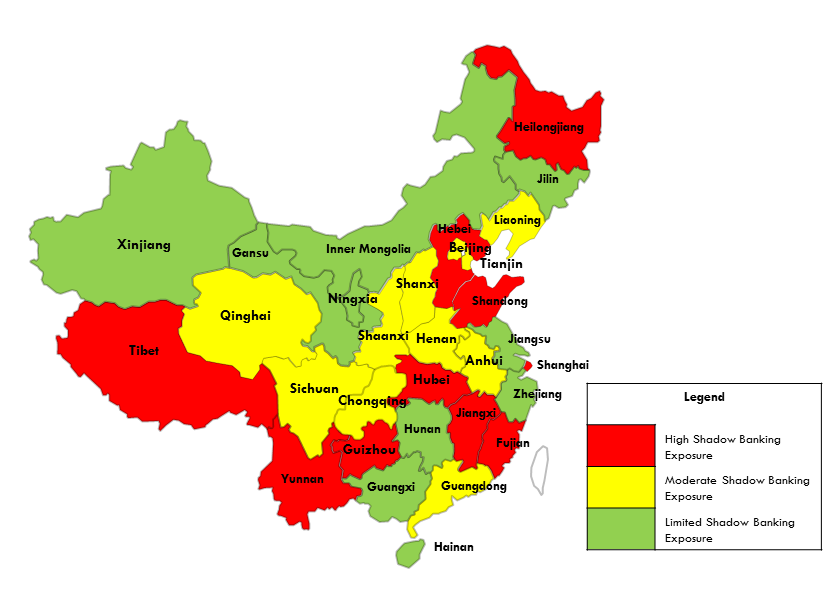
This week the People’s Bank of China (PBoC) released the total social financing data for 2013 disaggregated by province. The data reveals that exposure to shadow banking products is not evenly distributed, with off-balance products accounting for a much higher share of social financing in certain provinces. The map below shows shadow banking exposure by province, grouped into a top, middle and bottom third.
Shadow Banking Share of Total Social Financing by Province
The top ten provinces by exposure to shadow banking are the following:
|
Shanghai |
46% |
|
Tibet |
45% |
|
Heilongjiang |
45% |
|
Guizhou |
42% |
|
Yunnan |
42% |
|
Shandong |
40% |
|
Hubei |
39% |
|
Fujian |
38% |
|
Hebei |
38% |
This regional data is a window into localized financial risk in China. Many of the provinces on the periphery, including Tibet, Yunnan, Guizhou, and Heilongjiang, have high levels of shadow banking exposure. Other clusters include Hebei/Shandong and Fujian/Jiangxi/Hubei. However, the true share of shadow banking in each province may be somewhat muddied by the role Shanghai, Beijing, and Chongqing play as regional financial hubs
The provinces with higher levels of exposure these off-balance sheet products will be more vulnerable to defaults and financial distress as these products mature. A natural response for financial regulators in these areas would be to apply heightened scrutiny to local financial institutions.
An interesting exercise is to match these figures against local indebtedness to see which provinces have the most capacity to bail out failing financial institutions. The graph below shows local debt relative to GDP in 2012 for the provinces for which we have data.
Provincial Debt to GDP and Shadow Banking Exposure
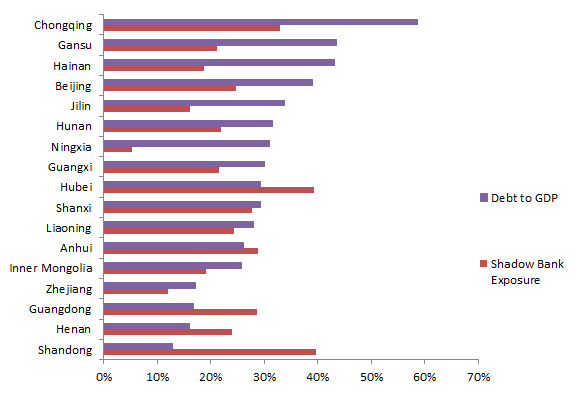
The data on local government debt at this stage is piecemeal, official numbers are likely lower bound estimates. Moreover, the data for many provinces are not available, making it impossible to perform a comprehensive analysis. Determining the overlap of over-indebtedness and exposure to shadow banking should be a top priority for those tracking financial risk in China.